{quote} For a valid Trade I think H4 and Daily Charts both has to agree and meet all conditions in the first page. Or am I missing anything here ?
Ignored
RH would say if its a valid H4 setup then take it. The daily candle is still forming and waiting for it to show its direction might lose you some trades.
{quote} RH would say if its a valid H4 setup then take it. The daily candle is still forming and waiting for it to show its direction might lose you some trades.
Ignored
oh really?
okay let me check and read again. I missed many trades .
let’s wait for RH or Emma for their inputs and their exceptions and how they traded before .
I am recently following I read only initial posts, many be someone will share their experiences.
I can say i only use the 4h candle. I dont go to higer timeframe to confirm the trend. Sometimes i go to 1h to find a good entry. But the 4h tells me the trend.
here is my prcedure:
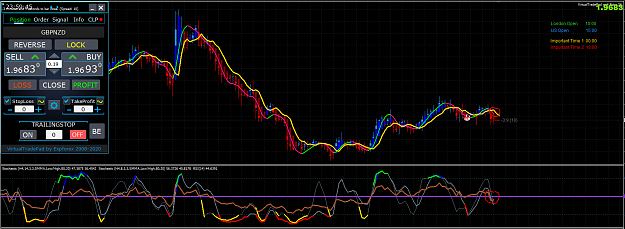
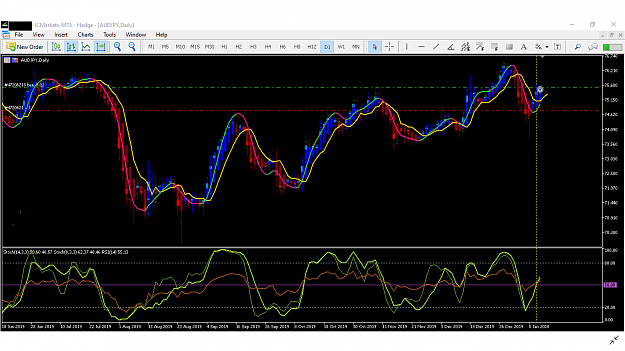
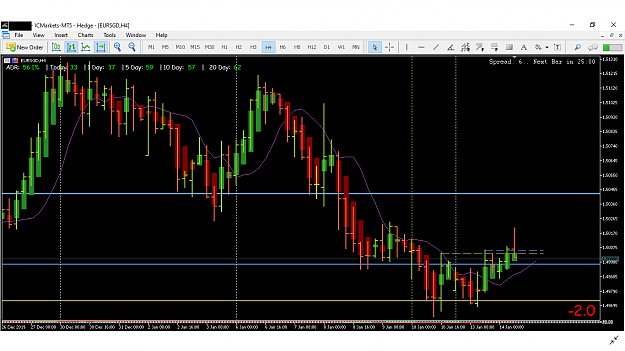
- i wait for the the 11:00 CEST candle to form and the EU marked to open. So 15min prior i check all the chart to find situations like the picture below, where 2xstochs and RSI all cross together. To me thats a very strong signal.
- then i look at the chart to confirm the HMA (green/pink) have crossed the MA (gold), up or down. In this case down (pink).
- The signal has so show clearly when the time hits 11:00 CEST and the candle closes.
If this is the case, then i take the info from the Trading Info panel, and set a lot size matching 2% of the balance. Add the order, SHORT or LONG and drag the SL 2 bars back.
Thats how i use the system and how i set up rules to match my trading style. I do get falls signals too, but the reason why im in profit, as i see it. Is when i hit a good trend, you can stay there for many hours.
If the trade goes agains me, i will usually close before the SL is hit. Then i just close on a revers signal and use the daily chart to check the overall trend, and deside if i want to stay in or close right away.
I usually avoid trading other candles than the 11:00 CEST candle and i allways try to close trades before going to bed.
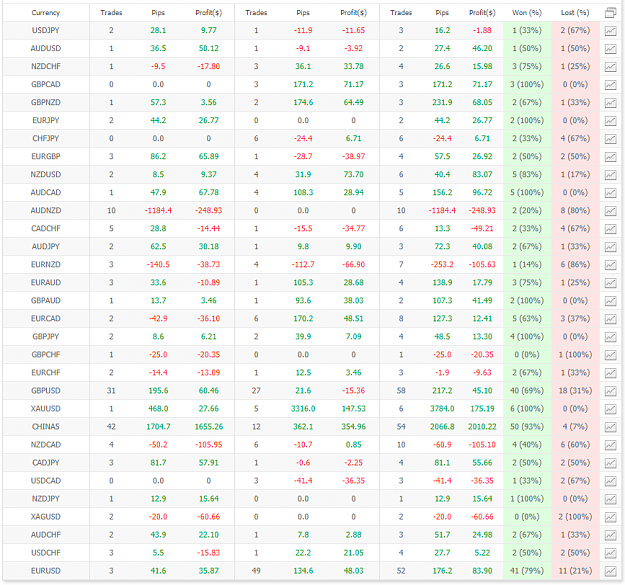
Below is all my trades from the 4th of december till now. And some one said that it was properly luck when not using the daily to confirm the trend. I wont say that some trades wasnt lucky, but with this many trades in a little over a month. Its not all luck...
Some trades where still made while learning and using the system as i like it.
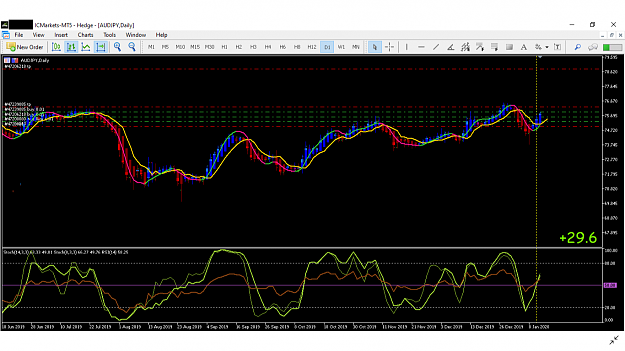
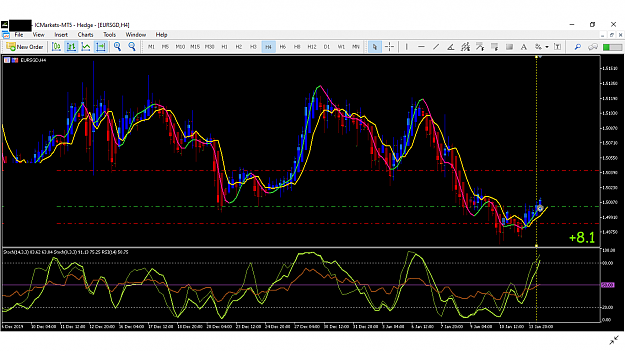
Sure will share what i can. Here is the only current trade im in going into the weekend. Its a continues trade that i did today. The candle is blue, the MA is green, both stocks are above. So i was waiting for a candle to close with the 3 candle rule where the RSI would close above the 50 line. And it did, so i took the trade. It really is that simple. I just follow the rules and dont enter to early. Wait for all indicators to show the right signal and the candle to close. Its hard to say more... its all in post no. 1 {image}
Ignored
thank you of being helpful
I also try continuation trades in the past because robinhood said focus only on continuation because its easy
but I lost most trades although I used same rules like you
you focus on continuation only or you take cross trades too? and you look at bigger time frame too or just on time frame you trade?
what ever you do just dont leave the tread because we need you
I am preparing the setups for the coming week. Just trying to summarize the dashboard for 30 instruments. Red - Sell ( 6 or 7 indicators signaling Sell ) Blue - Buy ( 6 or 7 indicators signaling Buy) White - Not clear ( If two or more indicators not signaling the same direction then stay away) Note : I consider buy or sell based on the current signals by checking all 7 indicators. If 6 indicators out of 7, the I prefer to buyor sell based on the higher time frame. That would be helpful, if we have a automated Dashboard and Alert mechanism to reveiew...
Ignored
Just curious if anyone ever came up with an automated alert dashboard?
I can say i only use the 4h candle. I dont go to higer timeframe to confirm the trend. Sometimes i go to 1h to find a good entry. But the 4h tells me the trend. here is my prcedure: - i wait for the the 11:00 CEST candle to form and the EU marked to open. So 15min prior i check all the chart to find situations like the picture below, where 2xstochs and RSI all cross together. To me thats a very strong signal. - then i look at the chart to confirm the HMA (green/pink) have crossed the MA (gold), up or down. In this case down (pink). - The signal...
Ignored
Interesting.
Something called CHINA5 is responsible for ~80% of the profit, while the performance of forex pairs is mediocre, especially the disastrous AUDNZD. I assume CHINA5 is a kind of index or ETF, right? I can't find it, maybe you could locate it on TradingView? It would be interesting to take a look at something of such an incredible performance.
{quote} Interesting. Something called CHINA5 is responsible for ~80% of the profit, while the performance of forex pairs is mediocre, especially the disastrous AUDNZD. I assume CHINA5 is a kind of index or ETF, right? I can't find it, maybe you could locate it on TradingView? It would be interesting to take a look at something of such an incredible performance.
Ignored
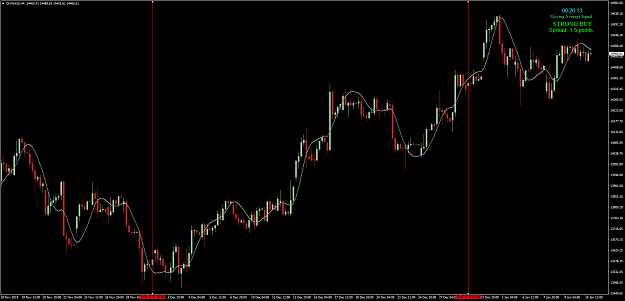
On IC Markets there is something called CHINA50, FTSE China A50 Index. Strong trend in December.
I can say i only use the 4h candle. I dont go to higer timeframe to confirm the trend. Sometimes i go to 1h to find a good entry. But the 4h tells me the trend. here is my prcedure: - i wait for the the 11:00 CEST candle to form and the EU marked to open. So 15min prior i check all the chart to find situations like the picture below, where 2xstochs and RSI all cross together. To me thats a very strong signal. - then i look at the chart to confirm the HMA (green/pink) have crossed the MA (gold), up or down. In this case down (pink). - The signal...
Ignored
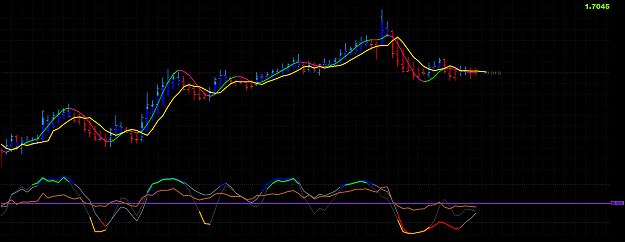
this is entry? all 3 indicators under 50 and we have red bar under yellow ma and hma is pink
acording for rules it is valid entry, no?
i think AJ really not bad.. MN above 5emas2, master candle breakout up direction; W1 no weekly bearish continuation candle, OHLC above 5emas2, rejecting the MN MC high and closed above it as well as closed higher than the previous week; D1 TMSr long with stochs in unison.. there is space on D1 above about 80pips.. at the moment, only 1 position, will use mulitple entry position..
edit: will be starting to trade live on mulitple entry and exit, tried on demo meme works... but i dont know whether it will work using a small account.. haha.. worst case, account is busted..
Attached Image (click to enlarge)
EDIT 2: now after a minimal difference of 4 hour and a minimal difference of 0.5 of 100ADR, entered another position.. also price didn't retrace since the 1st position... then calculate the average price, move the SL accordingly, then trail accordingly.. this 2nd position TP will be 0.5ADR distance from EP... while the 1st position will be left running with a TP placed in case price shoot up.. now let the probability work...
Attached Image (click to enlarge)
btw, all these is learnt from emm's posts (hope i don't understand it wrongly).. only that my account is too small such that 0.2%R is 0.01 lot (actually not even 0.01 lot, i have to round it up)... but i'm comfortable if i lose the money, so yup, let the probability works.. haha
{quote} On IC Markets there is something called CHINA50, FTSE China A50 Index. Strong trend in December. {image}
Ignored
Yes, probably so. Nice and smooth moves. I however can't see 54 entries here. Perhaps tes724 has made a lot of re-entries on the 5m TF. Anyway, December was indeed a goldmine on the index futures.
{quote} thank you it may be why I lost most trades I have to see when its range and when trend
Ignored
Yeah, can be tricky spotting ranging or trending. Maybe draw some horizontal lines on the tops and bottoms of the candles and wait for a close outside of the lines.
Or could use the ADX indicator to check value above 25 to show a trending situation.
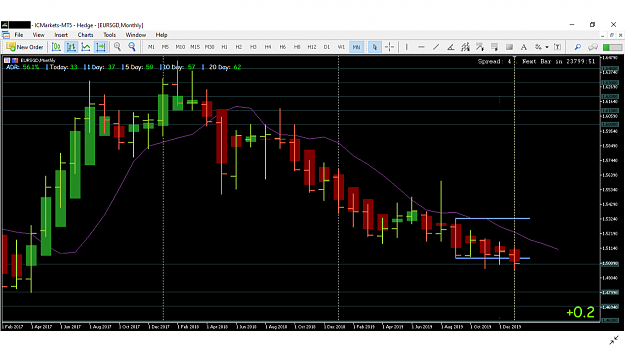
this is against the trend, but anyway MN W1 and D1 is bearish actually, but W1 market type is ranging sideway, still better to sell than buy...
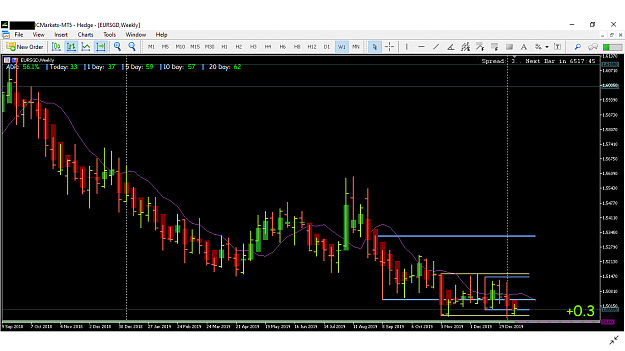
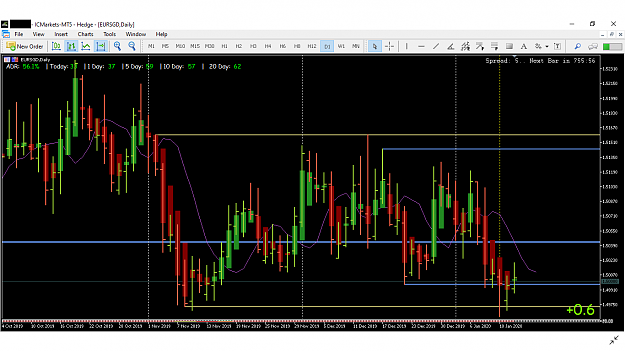
but i buy... haha.. price is at MN master candle (MC) low with a higher close previous month, price is also at W1 MC low, LL LC, D1 has a relatively long pin bar rejecting W1 MC low and BRN 1.5... then H4 has master candle up breakout with the last 4 bars above 5emas2 and HH HC for the previous 2 bars..
so yup enter a H4 TMSr long, stoch not in unison.. 4th blue bar, but i think it is still alright as i like the price action.. TP maybe should be way much higher at around W1 MC high but, W1 last week is LL LC and the candle is rather big... so i think 2R profit is good enough for me.. let see if it even reach there..
Attached Image (click to enlarge)
EDIT: decided to add more charts so the words may be clearer...
however do note that do your own research from the post4539 below on the way emm shares his trades...
my posted charts below somehow someway, it is modded to my own understanding of what emm posted.. so better see the original idea and make it your own..
Attached Image (click to enlarge)
Attached Image (click to enlarge)
Attached Image (click to enlarge)
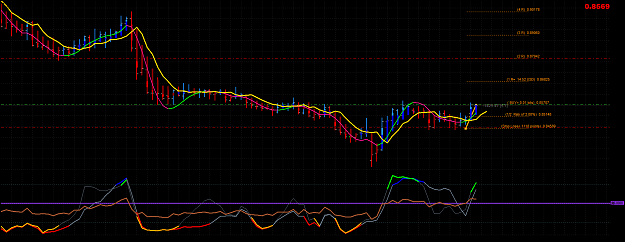
Here in D1 chart, one can see how that D1 reacts to the W1 MC low and closes just nice at around there... around BRN 1.5... amazing MC high and low
Attached Image (click to enlarge)
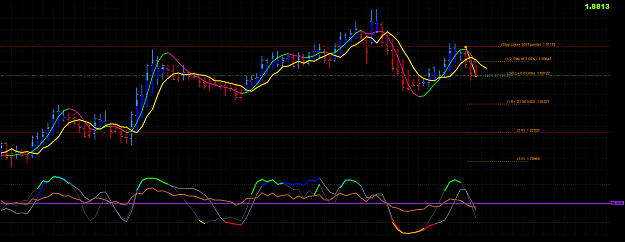
Here in H4, one can know that it is in consolidation -> so don't enter any trade until your personal other technical analysis is logical enough to risk some money for the trade
this is against the trend, but anyway MN W1 and D1 is bearish actually, but W1 market type is ranging sideway, still better to sell than buy... but i buy... haha.. price is at MN master candle (MC) low with a higher close previous month, price is also at W1 MC low, LL LC, D1 has a relatively long pin bar rejecting W1 MC low and BRN 1.5... then H4 has master candle up breakout with the last 4 bars above 5emas2 and HH HC for the previous 2 bars.. so yup enter a H4 TMSr long, stoch not in unison.. 4th blue bar, but i think it is still alright as i...
Ignored
Hi Boss, Can you explain what a MN master candle is please.
Just found this on google The formation of a true Master Candle can be seen on a chart if the next four candles are consolidating inside of the tall Master Candle.
{quote} Hi Boss, Can you explain what a MN master candle is please. Just found this on google The formation of a true Master Candle can be seen on a chart if the next four candles are consolidating inside of the tall Master Candle.
Ignored
Hey alan, my 2 cents...
actually i myself still unclear about the specific definition of master candle (MC) or WRB... all those i learnt are from emm's posts.. so search with emm's nick.. in the end, terminology wise, as a newbie, i don't find them important... lol.. all i care is what helps me to read price action easier.. i behave this way as i'm overloaded with information from emm's posts...lol
i think there are several terminology:
Mother Bar/ Inside Bar ( one bar enclosed inside)
Double Inside Bar (MB/IB enclosed within a bigger MB)
Master Candle (if i'm not mistaken, enclosing within it are minimal 3 candles.. small ones then for sure that the biggest bar one is MC)
WRB i think it refers to Wide Range Bar, but it is more complex, there is a pdf on it, so i don't use that term as most likely i will be wrong..
anyway, i noticed emm's W1 market type is really useful on how to trade for that particular currency pair and one needs to know that MC as it is used to identify ranging sideway market type... those upper limit and lower limit are really useful especially for lower TF trading following the dominant trend...
also when applied to MN it is useful too...
when you try to apply to D1, i think one can find out easily that the market is in consolidation, and possible accumulation or distribution...
in H4 or H1 or M15 even M1, you can easily find out that PA is in consolidation...
so yup, try to search n read yourself, hope you have a much better understanding than me.
for example this post by emm (click and here), emm mentioned AU and EJ respectively is in 'sideways market type condition with Weekly range high - low'... then try to see on your W1 chart and noticed those numbers...
after reading several posts, you will noticed that emm is very consistent with his style for years... and you can back test and forward test, always the same...