• Home
  • Forums
  • Trades
  • News
  • Calendar
  • Market
  • Brokers
  • Login
  • Join
  • User/Email: Password:
  • 8:24pm
Menu
  • Forums
  • Trades
  • News
  • Calendar
  • Market
  • Brokers
  • Login
  • Join
  • 8:24pm
Sister Sites
  • Metals Mine
  • Energy EXCH
  • Crypto Craft

Options

Bookmark Thread

First Page First Unread Last Page Last Post

Print Thread

Similar Threads

Weekly Top-Down Technical Analyses 1,709 replies

Trading Crosses Using Correlation and Strength of Major Pairs 2 replies

Long Term Analyses - EURUSD, GOLD, and S&P 76 replies

USD/CAD - Loonie Toons, & mostly pointless analyses 2 replies

Lazy analyses thread 56 replies

  • Interactive Trading
  • /
  • Reply to Thread
  • Subscribe
  • 18
Attachments: Major Pairs/Crosses - Trading Scenarios, Analyses & Forecasts
Exit Attachments
Tags: Major Pairs/Crosses - Trading Scenarios, Analyses & Forecasts
Cancel

Major Pairs/Crosses - Trading Scenarios, Analyses & Forecasts

  • Post #1
  • Quote
  • First Post: Edited 4:37pm Feb 15, 2018 12:10pm | Edited 4:37pm
  •  KeenPips
  • Joined Dec 2015 | Status: Member | 7,483 Posts
Quoting KeenPips
Disliked
I have learnt that scenario trading is key to long-term trading success. You anticipate alternative market scenarios and look for a feasible trade setup as the market meets one of the scenarios. What about you?...KP
Ignored
Quoting KeenPips
Disliked
Traders often go into the market with a bias, at least a directional bias. But creating alternative scenarios; e.g. based on ranging, bullish and bearish market mode, is a largely safe-proof approach to the market. Based on the scenarios created, an 'if-then' strategy is developed to deal with whichever scenario the market eventually presents. Trade safe and prosper. KP {quote}
Ignored
Let's present insightful market analyses, charts and forecasts on major pairs/major crosses trading scenarios here primarily using higher time frames (H4 and above) or a combination of time frames.

Each poster is free to use their tools and techniques for reading, analyzing and forecasting the markets but the focus of this thread is on the major pairs (i.e. EURUSD, GBPUSD, USDJPY, AUDUSD, USDCAD, USDCHF and NZDUSD) and the major crosses they form without the USD (i.e. EURGBP, EURJPY, EURAUD, EURNZD, EURCAD, EURCHF, GBPAUD, GBPJPY, GBPCAD, GBPCHF, GBPNZD, AUDJPY, AUDCAD, AUDCHF, AUDNZD, NZDJPY, NZDCAD, NZDCHF, CADJPY, CADCHF, and CHFJPY).

Please do not post on exotic pairs, primarily because of their lack of liquidity and often erratic technical behaviour.

Here's an example of what we should be looking for and doing on this thread.

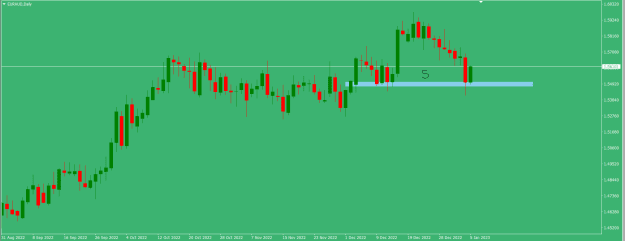
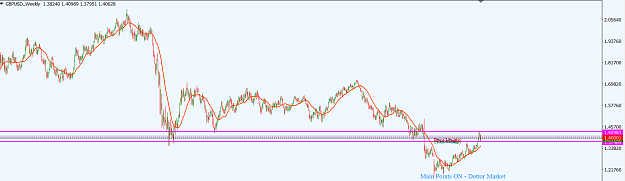
Price action on GBPUSD is currently in a strong reaction zone (1.37390/1.42920) that has held on a multi-year basis (See attached W1 chart). Bulls are likely to struggle to break the zone northward. Should bulls break out of this zone, there is likely to be a strong bullish continuation. But, based on the major trend, which is southward, any upward momentum is likely to be corrective, perhaps to target the 1.46790. Should bears wrestle the initiative and flip the zone, we may see a strong bearish momentum with bears targeting the immediate support zone around the 1.34810 area initially.

Trade safe and prosper.

KP

Attached Image (click to enlarge)
Click to Enlarge

Name: GBPUSD_Tech._Update_W1_15th_Feb.,_2018.png
Size: 31 KB


Disclaimer: This is not a signal service nor a provision of trading advice or trade calls. It is basically to share market analyses withn fellow traders. Each trader should trade based on their own rules and market judgments.
Do your homework, follow the footprints of smart money
  • Post #2
  • Quote
  • Edited 4:08pm Feb 15, 2018 3:53pm | Edited 4:08pm
  •  KeenPips
  • Joined Dec 2015 | Status: Member | 7,483 Posts
AUDUSD has been operating in an ascending channel for quite a while (bound by chocolate coloured lines in the attached W1 time frame). It has broken the channel mid-line (magenta) northward but not significantly. A support trendline (navy) is also in play. Current price action is around the 38.2/50 Fib retracement zone of the swing down from the high of September 2014 to the low of January 2016. Any further northward move is likely to meet a horizontal resistance around the 0.822270 area. This may present a highly feasible location for looking for a sell trading opportunity should bulls take price action to the level. Alternatively, a break of the support trendline (navy) southward is likely to dispose bears to target the channel support or the immediate horizontal support around the 0.74690 area. As the major market direction is southward, technically such a move is likely to expose the 0.68750 handle, although that is still a long way.

The intraday chart, represented by the H4 time frame, is still disposed northward within the channel. A northward break of the monthly pivot around the 0.79920 area by price action is likely to see bulls target the minor resistance around the 0.81065 area, which is in confluence with the 50 Fib retracement level. This does not preclude any sideways operation around the 0.81065 area or even a southward retracement before any further northward momentum can be sustained.

I may be wrong. Trade safe and prosper.

KP

Attached Image (click to enlarge)
Click to Enlarge

Name: AUDUSD_Tech._Update_W1_15th_Feb.,_2018.png
Size: 49 KB


Attached Image (click to enlarge)
Click to Enlarge

Name: AUDUSD_Tech._Update_H4_15th_Feb.,_2018.png
Size: 44 KB
Do your homework, follow the footprints of smart money
 
 
  • Post #3
  • Quote
  • Edited 3:47am Feb 16, 2018 3:34am | Edited 3:47am
  •  KeenPips
  • Joined Dec 2015 | Status: Member | 7,483 Posts
GBPJPY has been hugging a descending channel (bound by navy coloured lines) since the beginning of February 2018 (See attached D1 chart). This is actually a breakout of an ascending wedge (bound in chocolate coloured lines) which spanned the last quarter of 2017. Recent price action has been hugging the mid-line of the channel with a bearish mode. An initial target for bears is likely to to be the 146.630 area (magenta) but we may see their ambition extended to the 145.540 area (purple). However, should bulls manage to push price action above the mid-line, the 149.900 area may be targeted; but such a move is likely to be corrective as the major direction (on both MN and W1 time frames) favours the bears.

On the H4 time frame, price action is consolidating in a triangular pattern (chocolate). A breakdown of the triangle support is likely to see bears target the minor support around the 147.020 area. A retracement northward is likely to see bulls target the minor resistance around the 150.800 area.

I am bearish on this pair but there is need to wait for a significant break of the triangle. A rally up will be seen as a good sell opportunity by me. However, a breakdown of the triangle will have to be retested by bulls and rejected before I consider a sell trade.

I may be wrong. Trade safe and prosper.

KP


Attached Image (click to enlarge)
Click to Enlarge

Name: GBPJPY_Tech._Update_2_D1_16th_Feb.,_2018.png
Size: 40 KB


Attached Image (click to enlarge)
Click to Enlarge

Name: GBPJPY_Tech._Update_H4_16th_Feb.,_2018.png
Size: 40 KB
Do your homework, follow the footprints of smart money
 
1
  • Post #4
  • Quote
  • Feb 19, 2018 5:10am Feb 19, 2018 5:10am
  •  KeenPips
  • Joined Dec 2015 | Status: Member | 7,483 Posts
Price action on NZDUSD entered a significant resistance zone (0.74560/0.76237) in July 2017 and immediately rejected it southward. Since January 2018, bulls have pushed price action to retest the zone. Bears pressed price action southward in the early part of February 2018 but bulls are taking over the initiative. Although there is not much momentum on either side, it is apparent that bulls are very much intent on taking the market to the 0.74560/0.76237 zone (bound by magenta horizontal lines) in the attached monthly chart. This is the bigger technical outlook which traders should be cognizant of, particularly position and swing traders. A significant support zone is around the 0.70790 area, but this is not a main concern at the moment; it is likely to be a target of bears in the weeks/months ahead.

On the daily time frame, rejection or wicky candlesticks are lined up below the 0.74560 area but the technicals are still mixed. We may see a period of sideways operation before a strong push southward or northward can be sustained. An ascending trendline (black) from the low of December 8, 2017 is likely to be an initial target of any southward pullback. However, it is important to be aware of a minor horizontal support zone (bound in red horizontal lines) just a few pips below the current location of price action.

Trade safe and prosper.

KP

Attached Image (click to enlarge)
Click to Enlarge

Name: NZDUSD_Scenarios_MN_19th_Feb.,_2018.png
Size: 41 KB


Attached Image (click to enlarge)
Click to Enlarge

Name: NZDUSD_Scenarios_D1_19th_Feb.,_2018.png
Size: 44 KB
Do your homework, follow the footprints of smart money
 
1
  • Post #5
  • Quote
  • Feb 19, 2018 9:42am Feb 19, 2018 9:42am
  •  KeenPips
  • Joined Dec 2015 | Status: Member | 7,483 Posts
Here's a video on EURUSD and GBPUSD trading scenarios using a technical perspective.

I have no financial interest in any video presenter.

KP

Inserted Video
Do your homework, follow the footprints of smart money
 
1
  • Post #6
  • Quote
  • Edited 1:53pm Feb 20, 2018 8:22am | Edited 1:53pm
  •  KeenPips
  • Joined Dec 2015 | Status: Member | 7,483 Posts
Here's an update on the technical perspective on the NZDUSD. Yesterday, the daily candlestick was bearish and entered the immediate support zone noted yesterday (bound by red horizontal lines); see attached daily chart. The short-term market mood is bearish and we may see some southward pullback or sideways operation of price action. However, as long as the ascending trendline (navy) is still intact, technically the bulls are still favoured.

KP

Attached Image (click to enlarge)
Click to Enlarge

Name: NZDUSD_Scenarios_D1_20th_Feb.,_2018.png
Size: 39 KB


Quoting KeenPips
Disliked
Price action on NZDUSD entered a significant resistance zone (0.74560/0.76237) in July 2017 and immediately rejected it southward. Since January 2018, bulls have pushed price action to retest the zone. Bears pressed price action southward in the early part of February 2018 but bulls are taking over the initiative. Although there is not much momentum on either side, it is apparent that bulls are very much intent on taking the market to the 0.74560/0.76237 zone (bound by magenta horizontal lines) in the attached monthly chart. This is the bigger technical...
Ignored
Do your homework, follow the footprints of smart money
 
1
  • Post #7
  • Quote
  • Feb 20, 2018 9:52am Feb 20, 2018 9:52am
  •  KeenPips
  • Joined Dec 2015 | Status: Member | 7,483 Posts
Here's a video on scenarios involving EURUSD, GBPUSD and some majors for this week. I have no financial interest in the presenter.

Trade safe and prosper.

KP

Inserted Video
Do your homework, follow the footprints of smart money
 
 
  • Post #8
  • Quote
  • Feb 26, 2018 12:09pm Feb 26, 2018 12:09pm
  •  KeenPips
  • Joined Dec 2015 | Status: Member | 7,483 Posts
Consider the analyses done in this video based on market structure. I have no financial interest in the presenter.

KP


Inserted Video
Do your homework, follow the footprints of smart money
 
2
  • Post #9
  • Quote
  • Jul 8, 2018 10:11pm Jul 8, 2018 10:11pm
  •  memepapa
  • | Joined Apr 2018 | Status: Member | 18 Posts
Attached Image (click to enlarge)
Click to Enlarge

Name: EURAUD-8july副本.jpg
Size: 692 KB


EURAUD falling now despite +EUR trend, if its daily chart closes below 1.7750 today, could this be a head and shoulder reversal that leads to a 1,000 pip drop? targetting 1.4400s
 
 
  • Post #10
  • Quote
  • Oct 12, 2019 1:39pm Oct 12, 2019 1:39pm
  •  Bk55
  • | Joined Jun 2016 | Status: Member | 2,646 Posts
EU thoughts im thinking short the round number at res be nimble possible shoulder forming take tp1 early on
Attached Image (click to enlarge)
Click to Enlarge

Name: EU patternsssss.png
Size: 199 KB
Turn your wounds into wisdom
 
 
  • Post #11
  • Quote
  • Oct 12, 2019 1:48pm Oct 12, 2019 1:48pm
  •  Bk55
  • | Joined Jun 2016 | Status: Member | 2,646 Posts
AN thoughts monthly and h4
weekly close with bullish wick
Attached Image(s) (click to enlarge)
Click to Enlarge

Name: AN MONTHLY.png
Size: 174 KB
Click to Enlarge

Name: AN H4 GARTLY.png
Size: 197 KB
Turn your wounds into wisdom
 
 
  • Post #12
  • Quote
  • Oct 13, 2019 1:32pm Oct 13, 2019 1:32pm
  •  Bk55
  • | Joined Jun 2016 | Status: Member | 2,646 Posts
UJ h4 res with h4 wicks
15min entry thoughts
Attached Image(s) (click to enlarge)
Click to Enlarge

Name: UJ H4.png
Size: 174 KB
Click to Enlarge

Name: UJ 15min.png
Size: 196 KB
Turn your wounds into wisdom
 
 
  • Post #13
  • Quote
  • Oct 13, 2019 1:57pm Oct 13, 2019 1:57pm
  •  Bk55
  • | Joined Jun 2016 | Status: Member | 2,646 Posts
Weekly GBP/JPY
Weekly chart abc correction
Entry if i get it waiting for first lower low h4 at res then take the pullback not ruling out a deep C possibly 78.6
C waves typically range from 38.2 to 78.6
Attached Image (click to enlarge)
Click to Enlarge

Name: WEEKLY GJ.png
Size: 172 KB
Turn your wounds into wisdom
 
 
  • Post #14
  • Quote
  • Oct 13, 2019 5:06pm Oct 13, 2019 5:06pm
  •  Bk55
  • | Joined Jun 2016 | Status: Member | 2,646 Posts
Silver daily chart
Retraced 50% swing ABC correction waiting to see if the next low swing h4 fails to confirm C wave for set ups
Attached Image (click to enlarge)
Click to Enlarge

Name: SILVER DAILY ABC.png
Size: 189 KB
Turn your wounds into wisdom
 
 
  • Post #15
  • Quote
  • Oct 13, 2019 5:32pm Oct 13, 2019 5:32pm
  •  Bk55
  • | Joined Jun 2016 | Status: Member | 2,646 Posts
GBP/CHF Weekly lower low swing, ABC correction watching 1272 and 161 for reversal patterns on h4
Attached Image (click to enlarge)
Click to Enlarge

Name: cbp chf weekly.png
Size: 195 KB
Turn your wounds into wisdom
 
 
  • Post #16
  • Quote
  • Last Post: Jan 5, 2023 11:37am Jan 5, 2023 11:37am
  •  TheWolf
  • Joined May 2022 | Status: I'm Done | 2,577 Posts
EUR/AUD Daily
Attached Image (click to enlarge)
Click to Enlarge

Name: EURAUD Daily.png
Size: 12 KB
 
 
  • Interactive Trading
  • /
  • Major Pairs/Crosses - Trading Scenarios, Analyses & Forecasts
  • Reply to Thread
0 traders viewing now
Top of Page
  • Facebook
  • Twitter
About FF
  • Mission
  • Products
  • User Guide
  • Media Kit
  • Blog
  • Contact
FF Products
  • Forums
  • Trades
  • Calendar
  • News
  • Market
  • Brokers
  • Trade Explorer
FF Website
  • Homepage
  • Search
  • Members
  • Report a Bug
Follow FF
  • Facebook
  • Twitter

FF Sister Sites:

  • Metals Mine
  • Energy EXCH
  • Crypto Craft

Forex Factory® is a brand of Fair Economy, Inc.

Terms of Service / ©2023