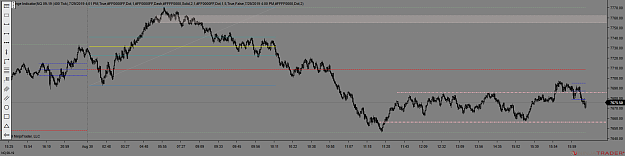
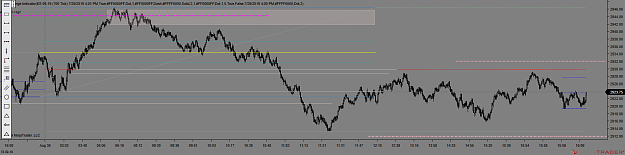
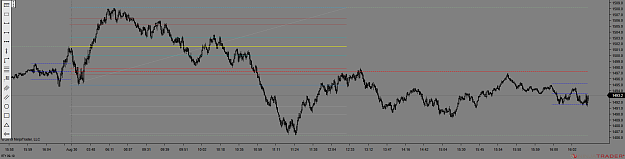
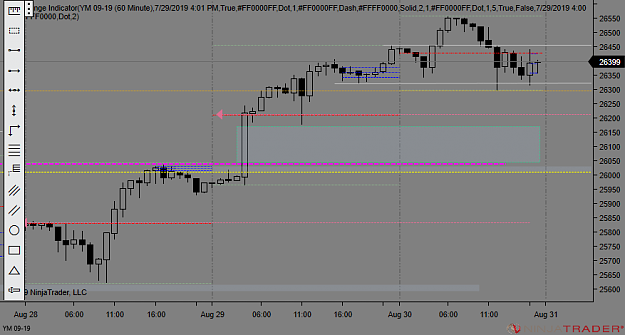
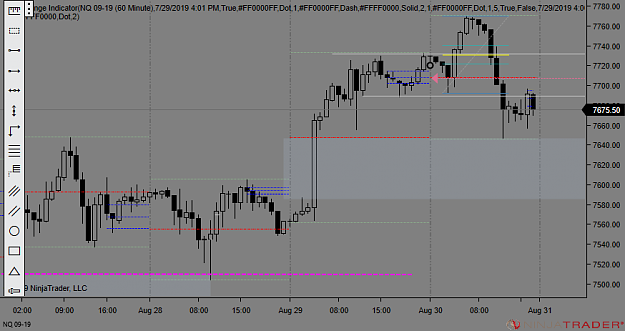
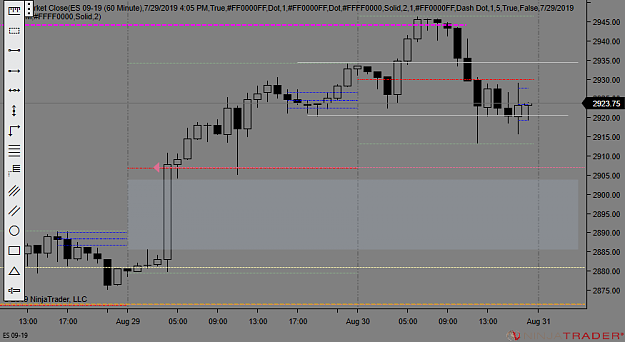
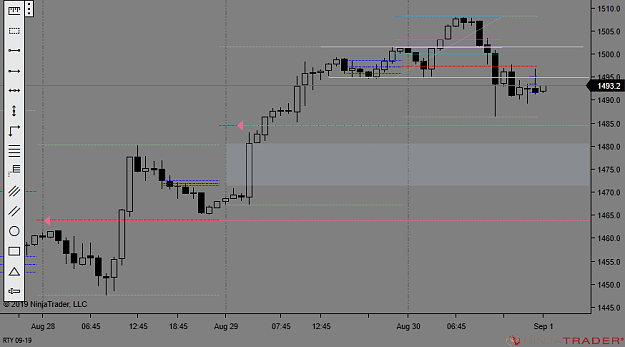
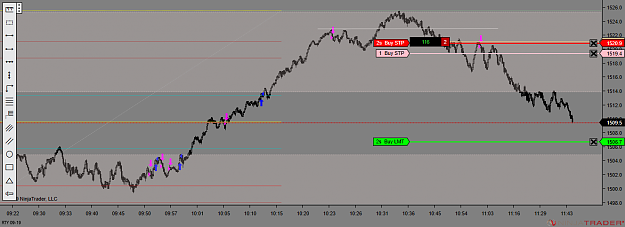
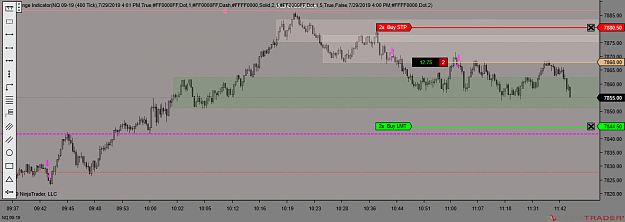
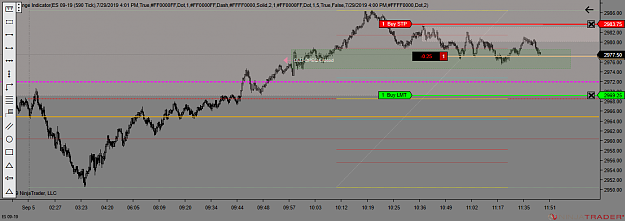
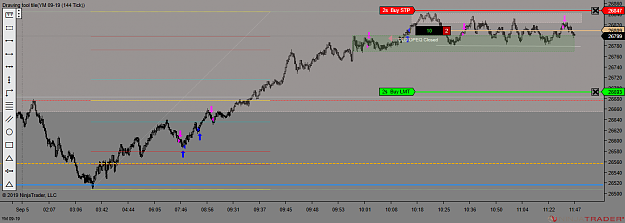
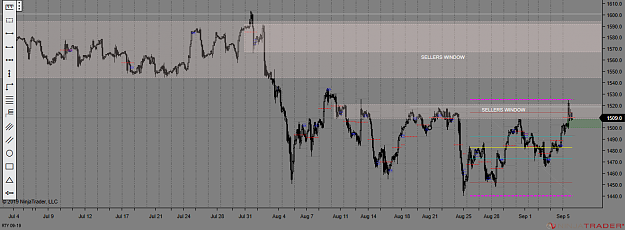
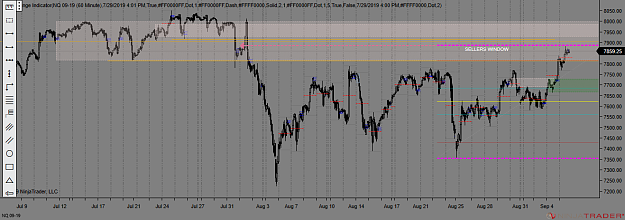
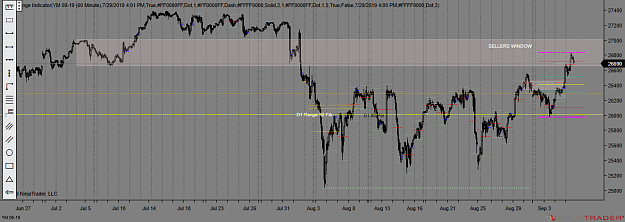
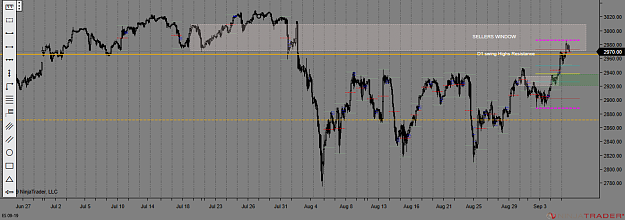
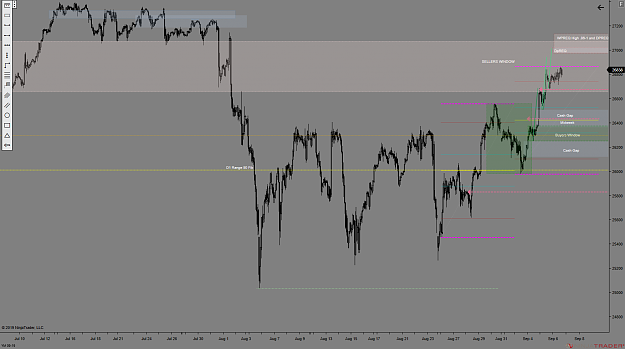
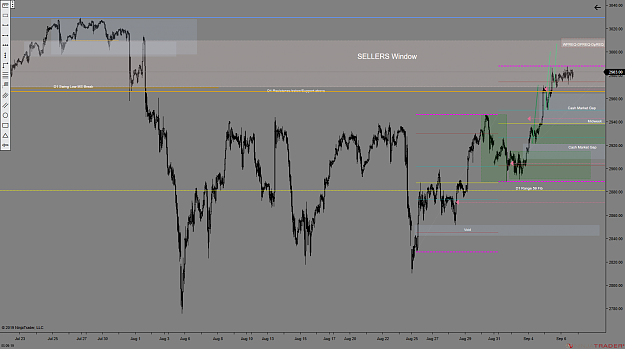
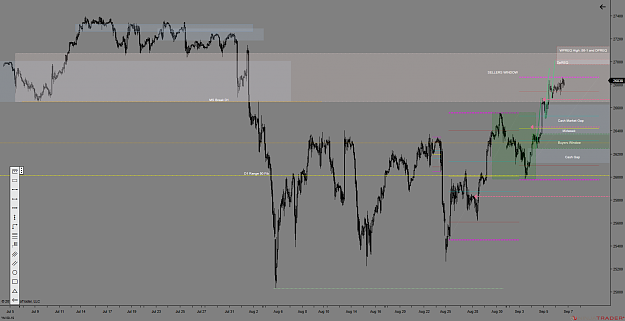
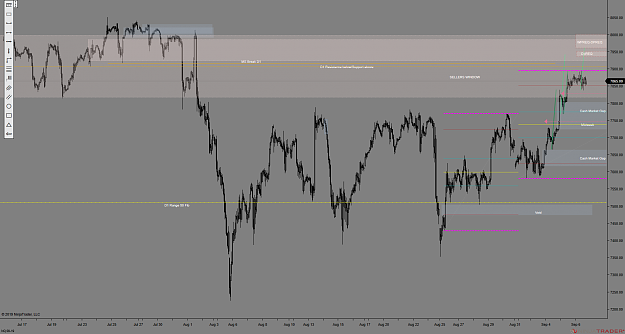
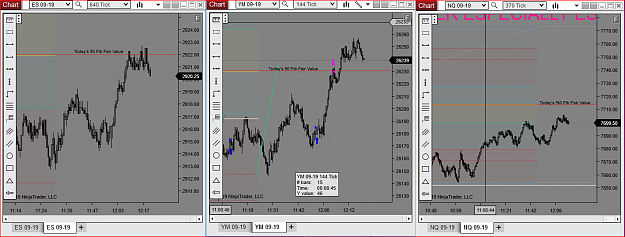
The charts show movement between the indexes in relation to the day's range and I use them as a tool for confluence and strength between the indexes, who is leading and who is lagging. Where one leads the others tend to follow. Like anything else it isn't true 100% of the time so like any other tool I use it as a tool to digest the possibilities and how it aligns to order flow and expectations. With today's environment the leader in strength is the YM and weakness is NQ so I take trades accordingly. I also take the time frame into consideration since the relationship between the indexes may be different for higher and lower time frames. I set up the tick charts to match on the three by condensing the 144 and by adjusting the number of ticks in the ES and NQ so that all condensed charts start at the same time at the left of the chart or at least come close(varies from day to day).
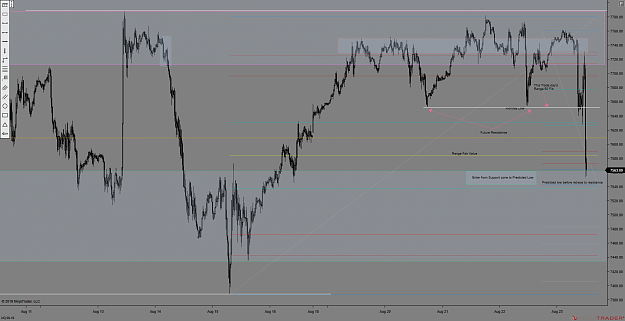
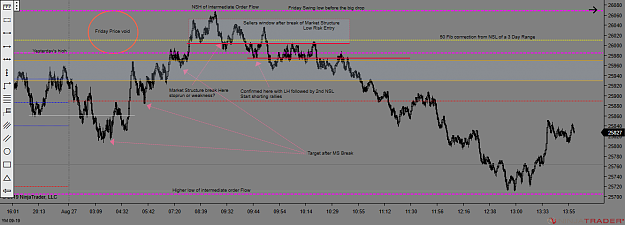
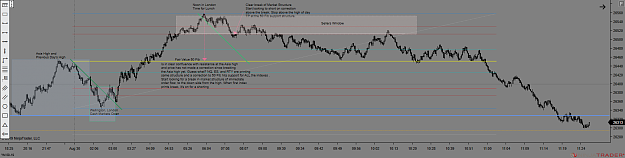
Attached Image (click to enlarge)
Anything is Possible!Side with the Probable!