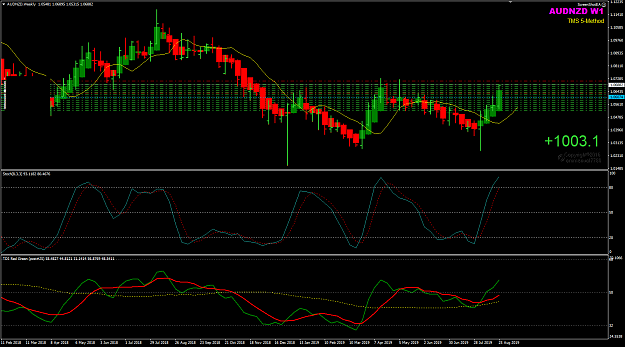
Disliked{quote} Emmanuel introduced the smTMMS indicator (trying again to divert this thread away from TDI). All I did was to fetch that indicator from Robin's thread. Don't know the pro's or con's of that indicator, only did a crude comparison and posted my findings. By what you have posted and the results (hindsight) I will stay away from using that indicator. ---- Your own post condemn smTMMS to the dustbin. How do you know when price is trending and when it is in consolidation? You don't see those condition to the right of price, you see them on the...Ignored
hey Tekkies,
You are confused again here. I did not introduce the smTMMS Oscillator. It is SwingMan who shared his work here in FF. Here is the link to SwingMan' thread title ...
" LazyHashi TMMS - Trading Made More Simple". You need to read and study SwingMan' thread and important to learn how to use the HeikenAshi candles.
https://www.forexfactory.com/showthread.php?t=928698
<>
Just because you can bring an indicator up on your chart doesn't mean you know how to use it correctly.
There are always going to be people who slam using Stochastics or any other indicator. Like you said... you have to learn how to use it like you have to learn how your favorite pair responds in the market place.
Learn to tweek your strategy to stay up with changing market conditions.
It's just part of the puzzle.
<>
And RobinHood' new thread title is "Trading Made Simple(r)".
You must do your own forward tests in live market conditions. You very crude comparison and findings do not represent the real market conditions. Do your forward tests for the first 100 trades, then move to 200 trades , then to 300 trades... by the time you completed 3,000 trades which may take 2 to 3 years, then you would have learned and know what how well the method performs in real market conditions.
To your question:
How do you know when price is trending and when it is in consolidation? You don't see those condition to the right of price, you see them on the left side of price.
Yes, we look to the left of our charts and that will show us the current market conditions and whether it has changed. We cannot predict the future market. No one can.
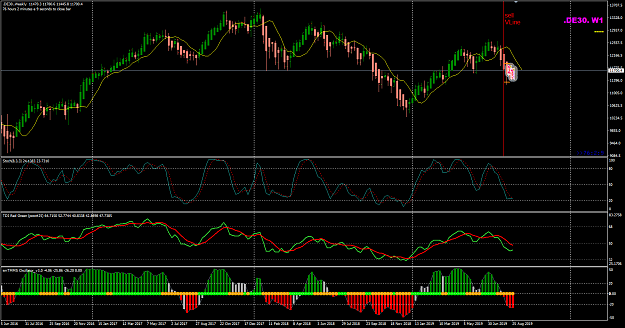
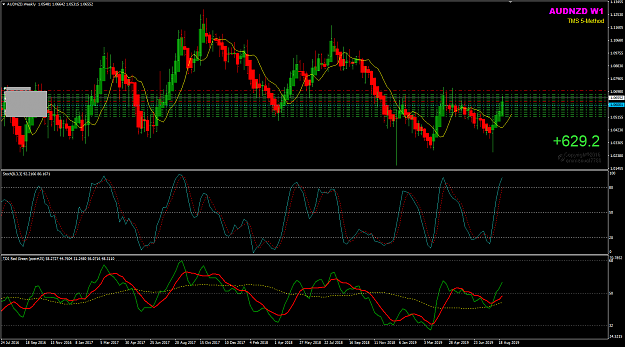
Below is how I view that portion of the market Aug 19 to 28 which you did you crude comparison and testing.
It is quite simple ... the same way I use Big E APB/HA candles and the 5EMA, Typical Price,Shift+3.
As you can see on y chart below, after that week Aug 12 to 16 closed, the market type condition has changed.
That took 3 weekly bars/candles to determine.
Attached Image (click to enlarge)
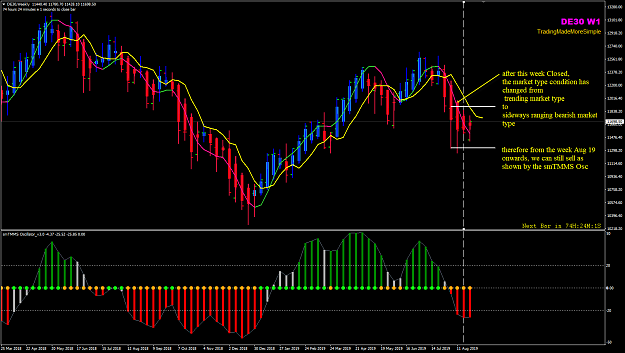
Look at SwingMan smTMMS Osc below, its is the 3rd bar red colour. And with that big Weekly bar Aug 5 to 9, that is the WRB High-Low Range which I would be trading.... until the market breaks out again.
more.../
Honesty is a very expensive gift. You wont find it in cheap people.WBuffett
1
2