For those of you who don't know, SwingMan, (FF's resident expert coder) has created a really cool dashboard for us that I have been using for about a week now and I really like it. I think it can REALLY help others who are struggling, and it can also help traders who want to see the "bigger picture" all at once (as I do).
The dashboard is called: smTMMS-RobinHood DB_v2.0
Download:
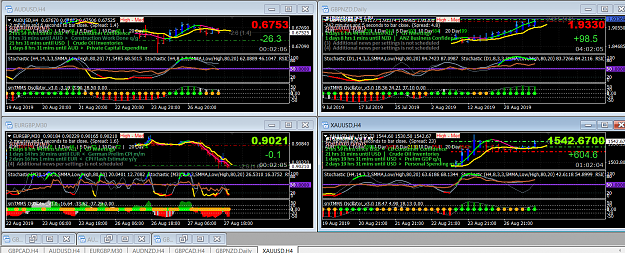
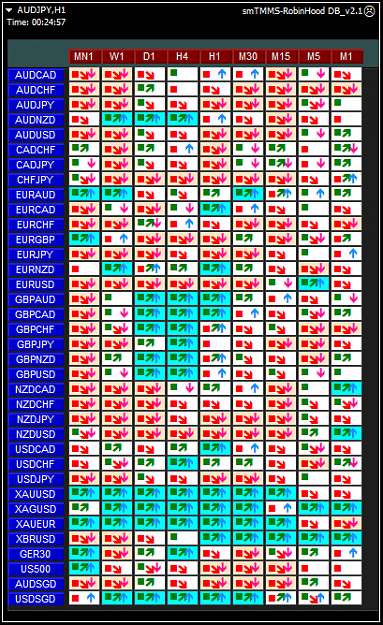
It's the dashboard on the left side in the image below. It allows you to easily see what the indicators we use are doing for every time frame all at the same time.
The way I like to use it is, if every indicator in the dashboard (or the VAST majority of them) are pointing DOWN, then I short (sell) the pair. If every indicator in the dashboard (or the VAST majority of them) of them are pointing UP, then I go Long (buy) the pair.
To install it, open your Data folder, then open your MQL4 folder, then open your Experts folder and place the dashboard in there.
Close MT4 and then reopen it.
Create ANY new chart, with ANY time frame and insert the dashboard on the chart. * You can also install it by opening your navigator (after you create a chart), then scroll down to Expert Advisors and highlight the smTMMS-RobinHood DB_v2.0 dashboard and DRAG it onto the chart you created.
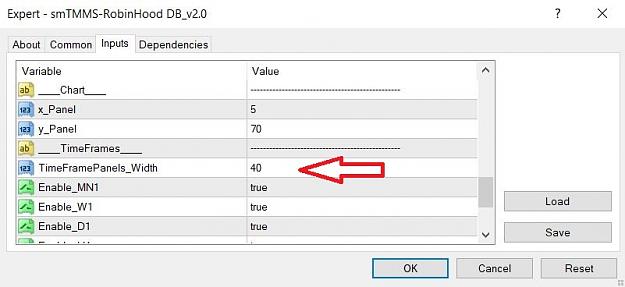
If you want to increase (or decrease) the width of the panel, you open the dashboard by clicking on the frowning smiley face in the VERY TOP right corner.

Then after you open it, scroll down to TimeFramesPanels_Width and change that number to increase or decrease the width of the dashboard. I use "40".
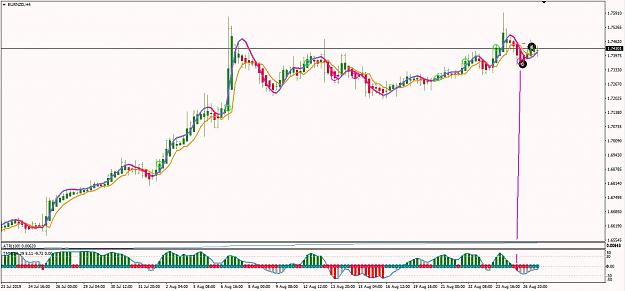
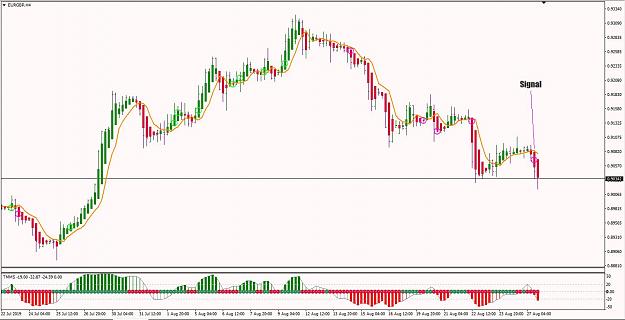
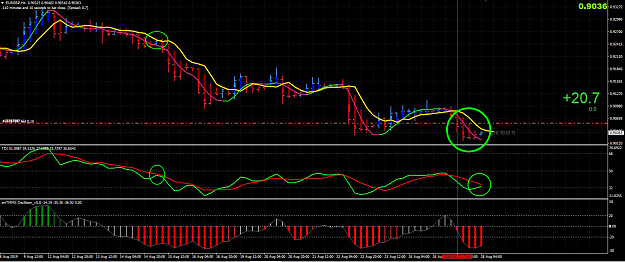
In the image below, in the yellow box, is an example of a pair that I would short:

The dashboard is called: smTMMS-RobinHood DB_v2.0
Download:
Attached File(s)
It's the dashboard on the left side in the image below. It allows you to easily see what the indicators we use are doing for every time frame all at the same time.
Attached Image (click to enlarge)
The way I like to use it is, if every indicator in the dashboard (or the VAST majority of them) are pointing DOWN, then I short (sell) the pair. If every indicator in the dashboard (or the VAST majority of them) of them are pointing UP, then I go Long (buy) the pair.
To install it, open your Data folder, then open your MQL4 folder, then open your Experts folder and place the dashboard in there.
Close MT4 and then reopen it.
Create ANY new chart, with ANY time frame and insert the dashboard on the chart. * You can also install it by opening your navigator (after you create a chart), then scroll down to Expert Advisors and highlight the smTMMS-RobinHood DB_v2.0 dashboard and DRAG it onto the chart you created.
If you want to increase (or decrease) the width of the panel, you open the dashboard by clicking on the
Attached Image
Then after you open it, scroll down to TimeFramesPanels_Width and change that number to increase or decrease the width of the dashboard. I use "40".
Attached Image (click to enlarge)
In the image below, in the yellow box, is an example of a pair that I would short:
Attached Image
Always a Student, Never a Master - Emulate What Works
9