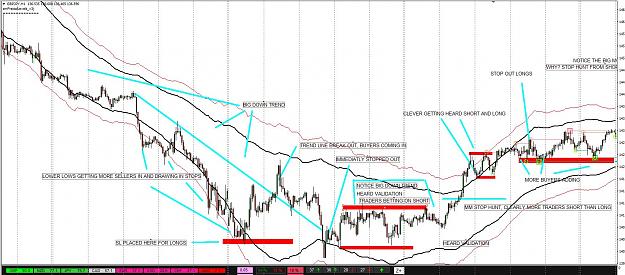
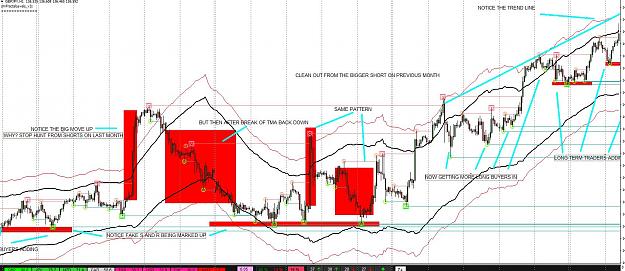
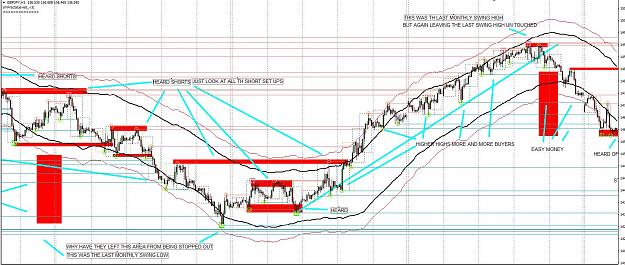
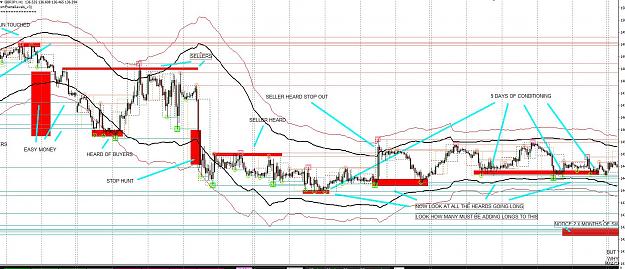
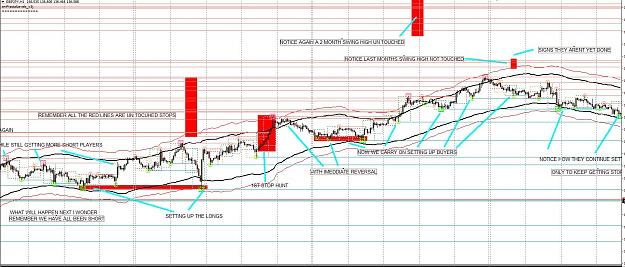
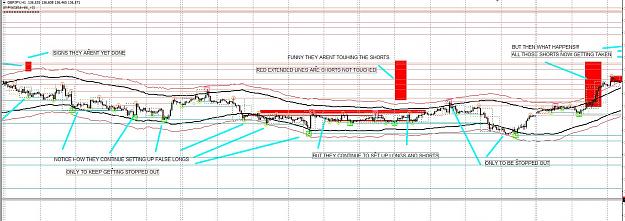
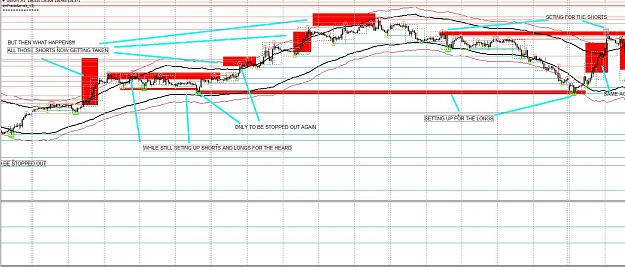
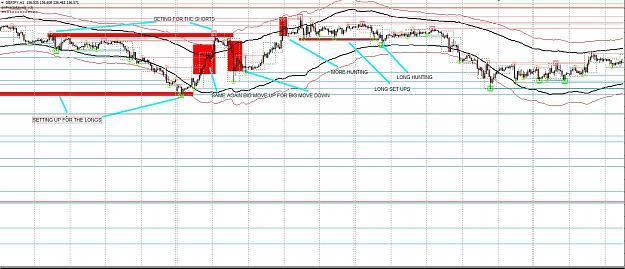
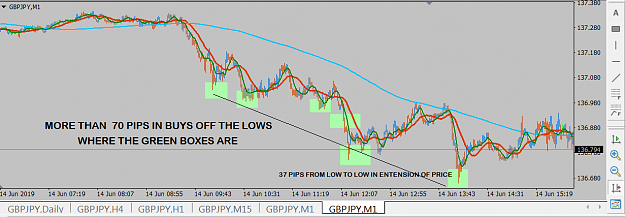
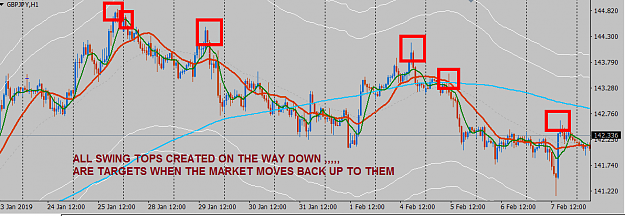
Disliked{quote} Hi MB I have attached 2 charts which I have marked up just for you (and because sharing is caring) showing money on the move, they also show how it is possible to follow the money, the market will always make higher highs and lower lows, you show me a chart over a 1 week period that is not doing this and I will show you a TF where even in a Ranging market PA is still making higher highs and lower lows. You have never been able to do it because you have not studied how PA is moving on every TF, you will have built your strategy/EA on just...Ignored
I wouldn't say that I hadn't studied price movement on every time frame.
Price is the same on all time frames, just the display of candles will be different.
Thank you for the charts, showing the highs and lows.
Until George popped along, I hadn't looked at a chart for a very long time.
I used an EA that I had built to take data from the COT Report, send to excel and number crunch. The issue...out of date data. Workable. Just ask my trading buddy Dave. We spent a long time with that. Prior to that was basket trading using T101's method.
My most successful EA was built based on a cut down version of the standard Basket 14 pairs from T101 group which you may be familiar with.
Using 10 pairs Hedged with a JPY bias and monitoring price movement there comes a time when the USD and JPY groups sync up and required a manual start.
From there, with the correct timing of entry and 10 x 0.01 feeler trades running, the fastest moving pair could be found and traded ''trend following''...this worked very well.
The original 0.01 trades would also cycle loss profit loss but that's a completely different method to Georges and not for this thread.
I have already seen the potential from monitoring Georges TMA in conjunction with the Hedge 10 pairs and now that i am completely relaxed with my manual trading I will investigate once again the Hedged 10 pairs.
Andy
3