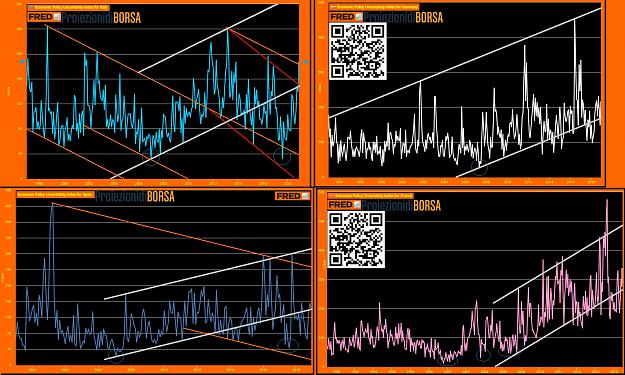
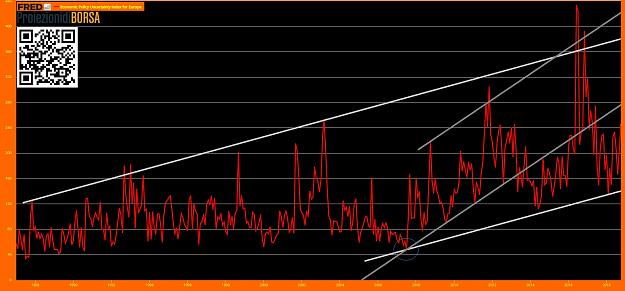
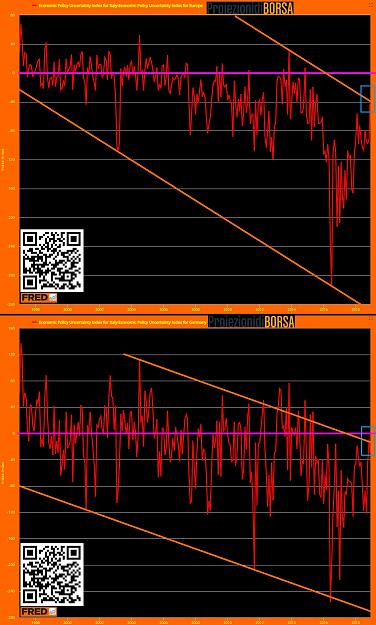
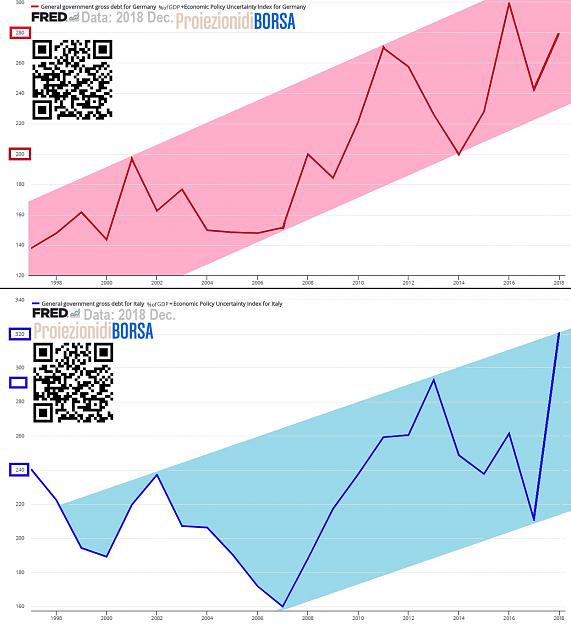
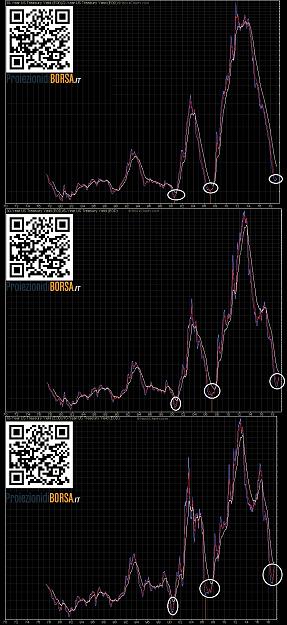
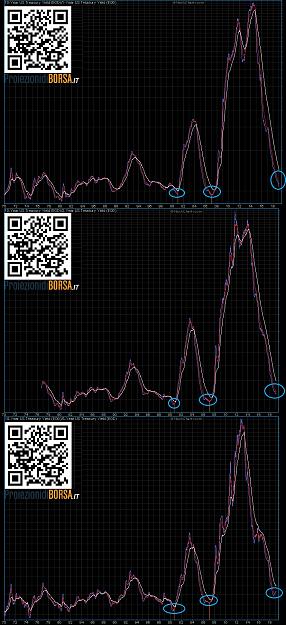
Graphical analysis of Economic Policy Uncertainty Indicators of Italy vs. Europe, Germany, France, Spain, according to rules of GraphicalContest.
![]() ► By ... 0000-0001-5086-7401 & goo.gl/MxYGqW ◀
► By ... 0000-0001-5086-7401 & goo.gl/MxYGqW ◀![]()
☒-{INFO Contact }-►►♡
☒ References.
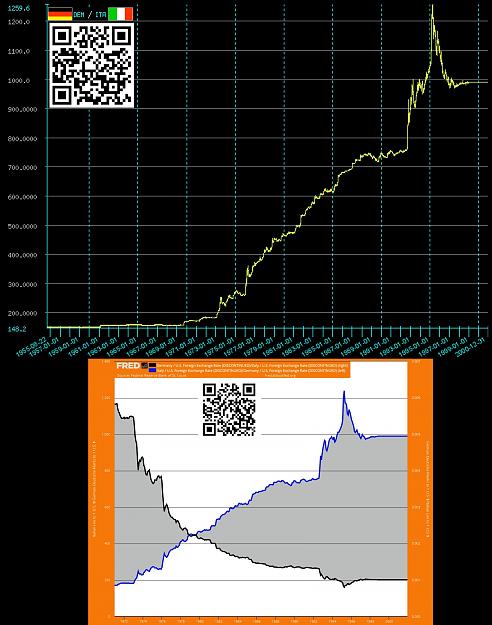
Financial Markets Observatory Lab. Some notes/charts about the macroeconomic curves of Italy & Spain, with a first European comparation. -https://www.researchgate.net/publication/262601624
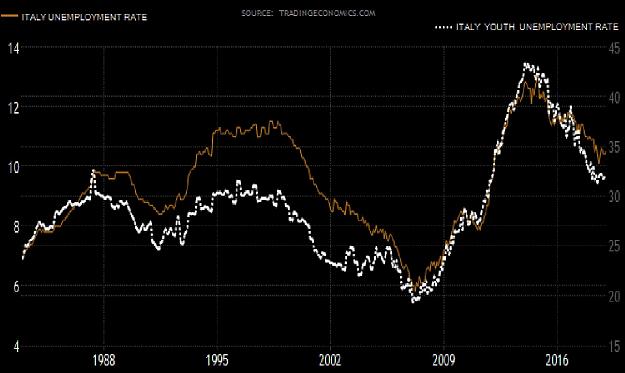
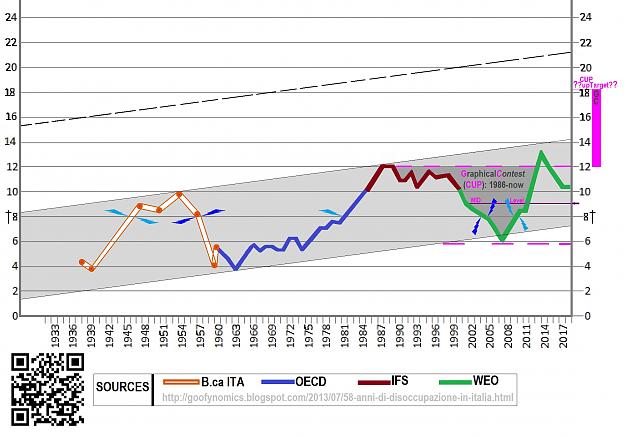
Financial Markets Observatory Lab. Some notes/charts about the employment curves of Italy. -https://www.researchgate.net/publication/260334530
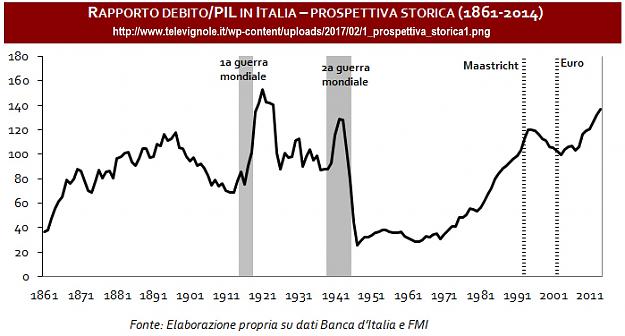
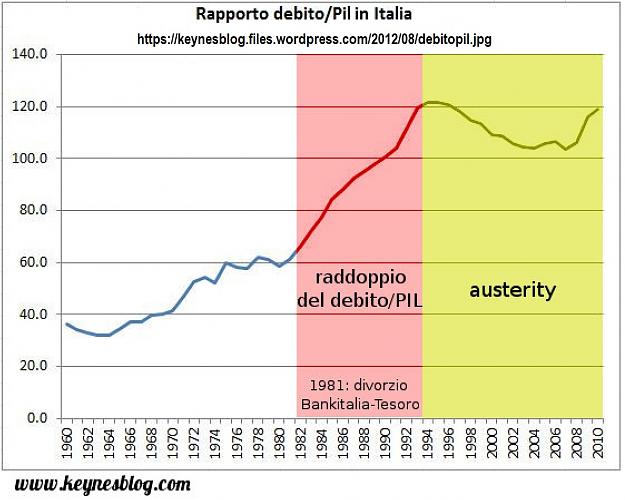
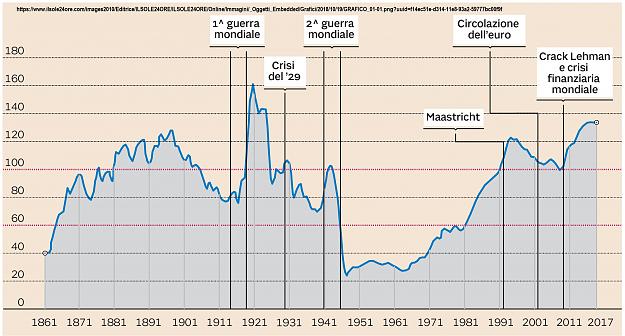
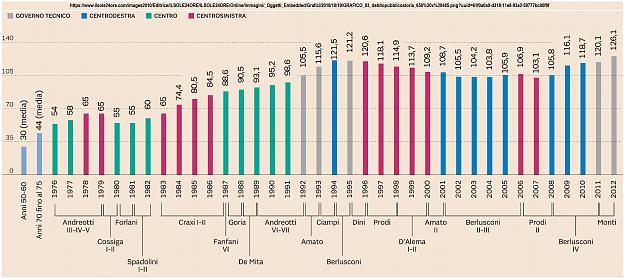
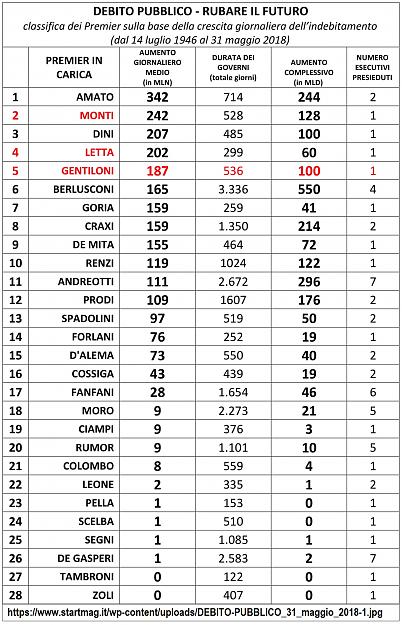
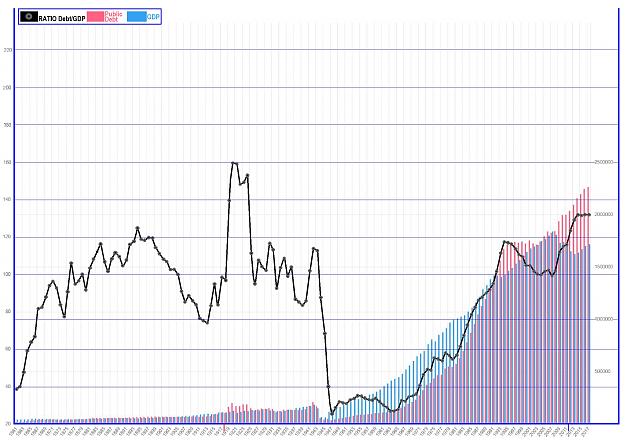
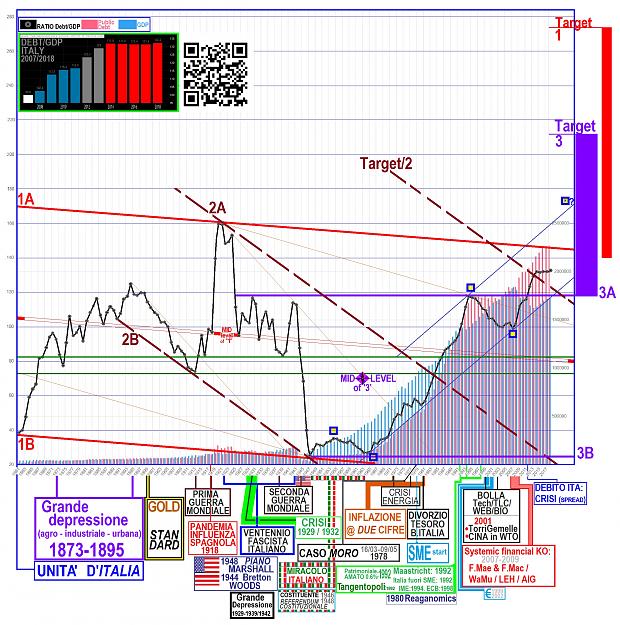
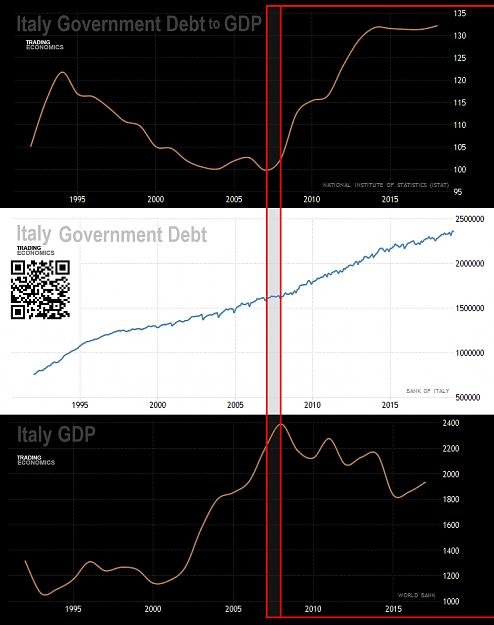
Financial Markets Observatory Lab. Some notes/charts about the historical curve of Debt/GDP ratio of Italy. -https://www.researchgate.net/publication/260136622
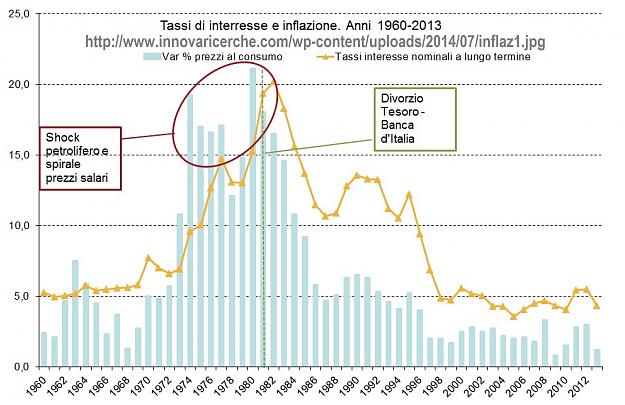
Financial Markets Observatory Lab. MacroEconomy curves of Italy. - https://www.researchgate.net/publication/258994945
Financial Markets Observatory Lab. Notes and charts about the qualitative correlation among Italian Confidence Indicators with some macroeconomic indicators and with two stock benchmarks of Italy. - https://www.researchgate.net/publication/274456601
Spread: l'errore infinito. - https://www.researchgate.net/publication/259656916
Poll Indicators for, BrExit, US Presidential & Italian Referendum in 2016. - https://www.researchgate.net/project...rendum-in-2016
Indicatori di stress finanziario in Italia. - https://www.proiezionidiborsa.it/ind...s-finanziario/
Attached Image(s) (click to enlarge)