EURUSD Weekly Technical Outlook
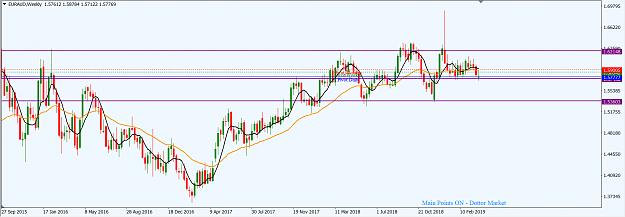
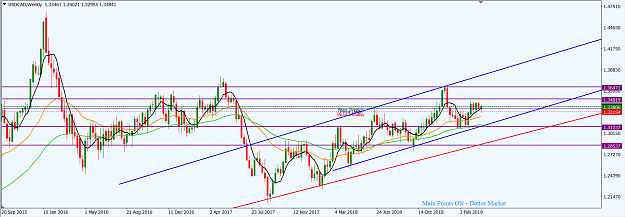
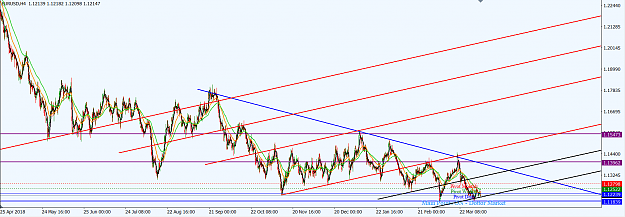
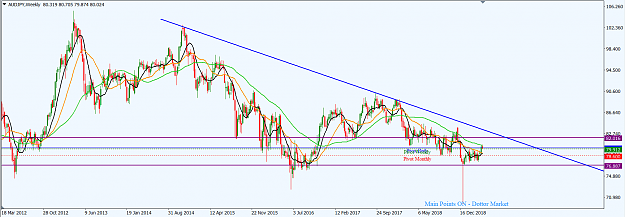
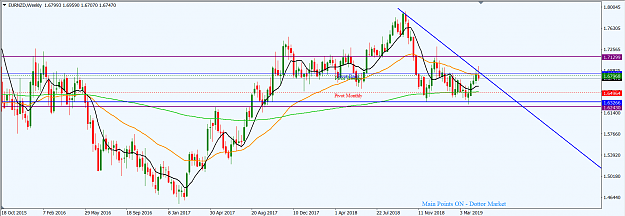
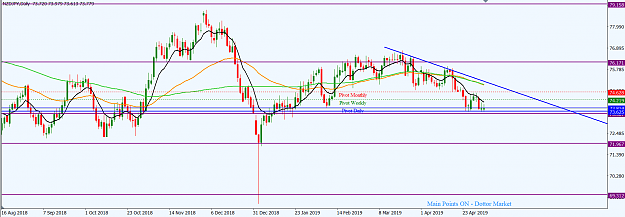
The EURUSD market is operating in a descending channel (red) traceable to 2009. However, it has been in an ambivalent phase so far this year. After been stuck in a sideways operation since January 2019, the EURUSD market disposed southwards in March, printing a bearish continuation candlestick on the monthly time frame. Nevertheless, the lower shadow on the candlestick indicates that we may see bulls make some attempt to take price action northwards, much likely in the early part of April.
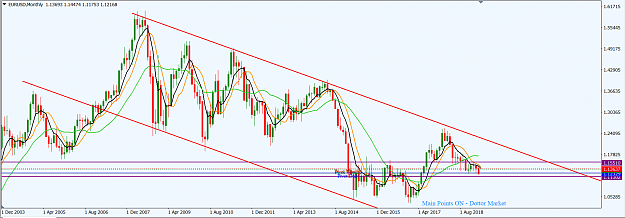
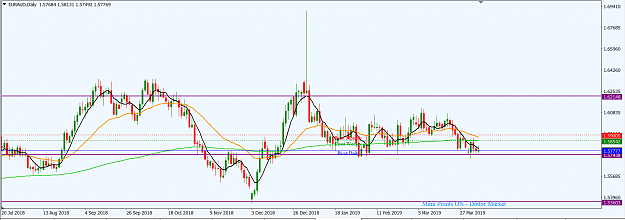
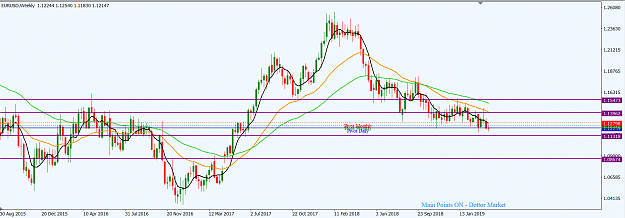
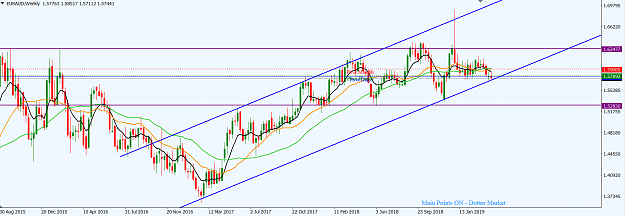
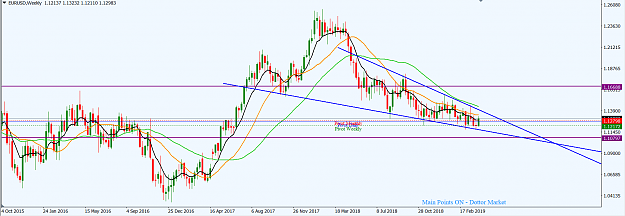
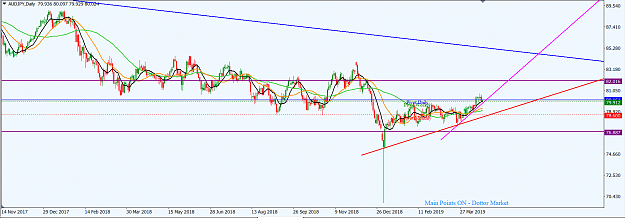
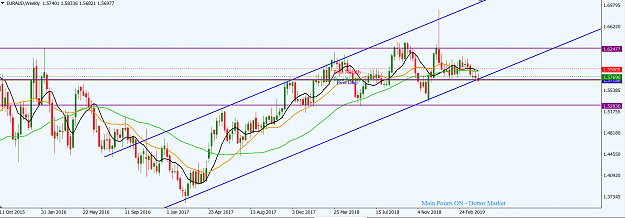
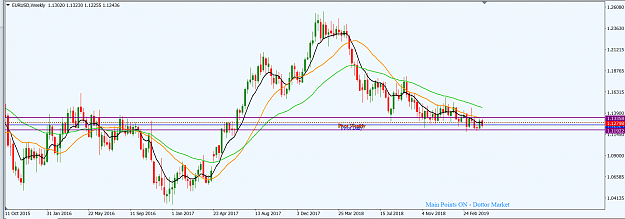
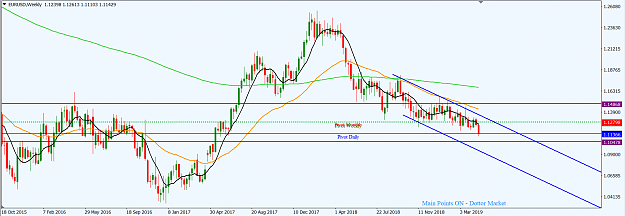
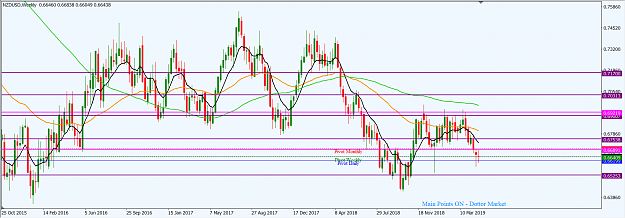
Price action is operating in a descending wedge (blue) on the weekly time frame. Last week, the market printed a bearish candlestick, which was a few pips shy of the wedge support line. The horizontal support is around the 1.11300 area, which is less than 100 pips from present location of price action. Therefore, we may see reduced bearish momentum until either after a northward pullback to an area of value or a breakdown of the 1.11300 area on at least a daily closing basis. Nevertheless, elementary wave analysis and other technicals favour the bears on a medium-term basis.

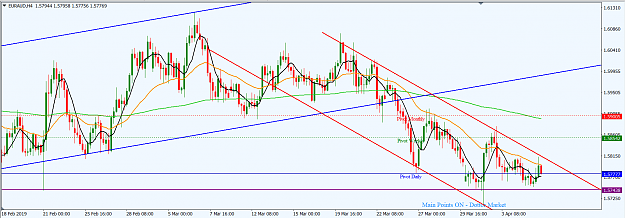
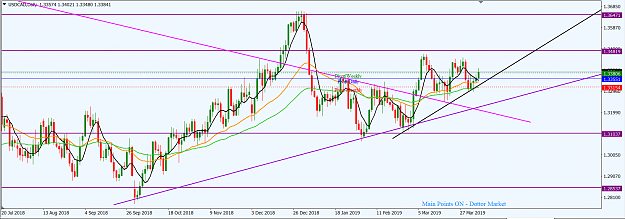
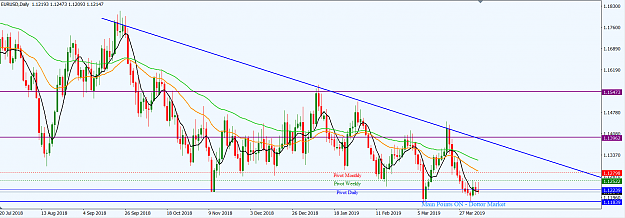
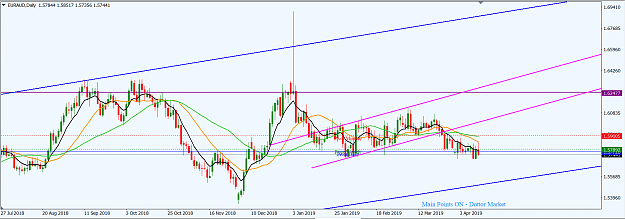
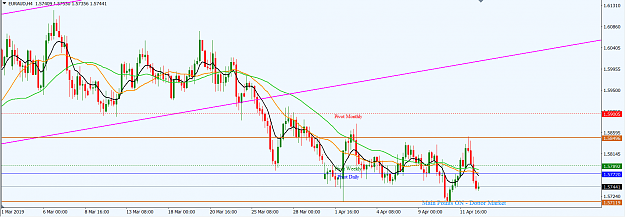
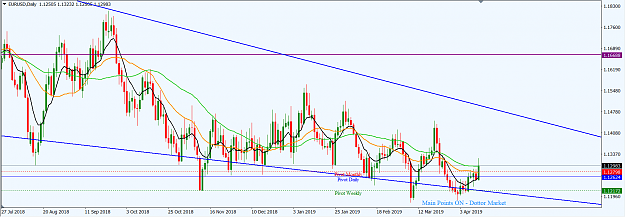
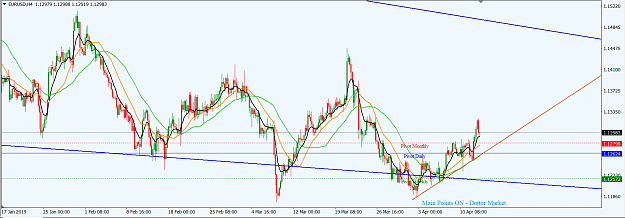
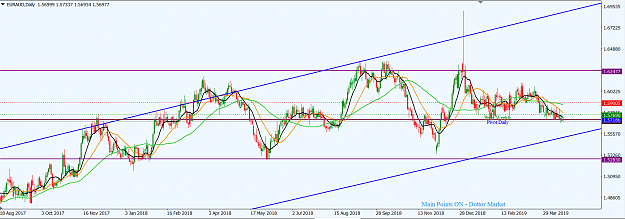
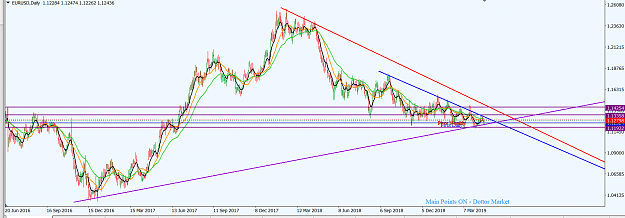
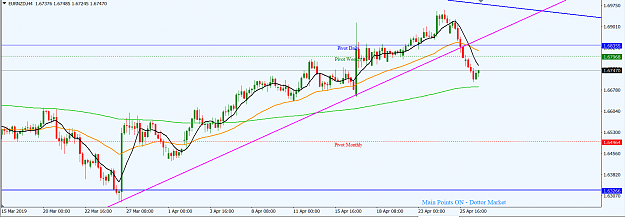
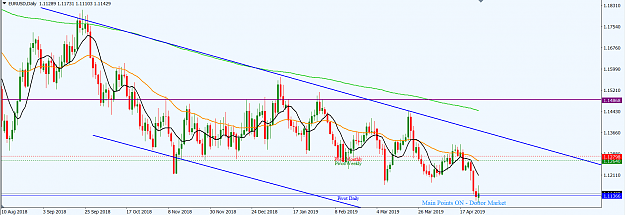
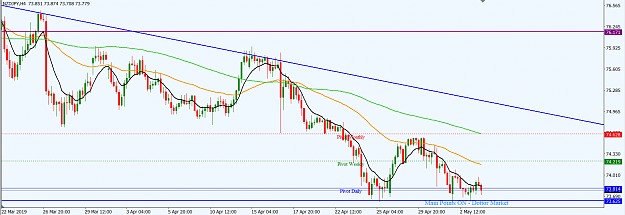
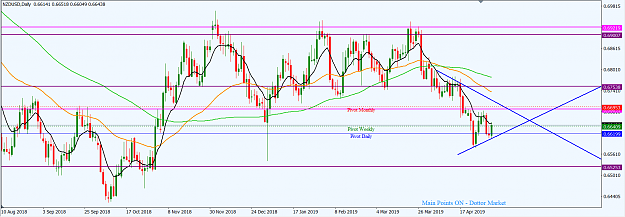
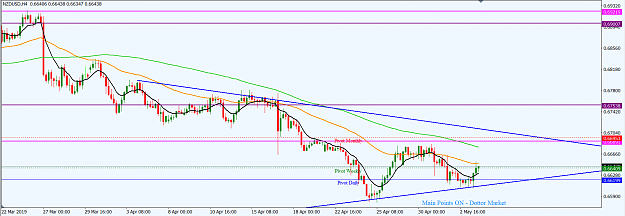
The daily time frame shows a market in a corrective phase of an impulsive downward trend. This operation is taking place in a descending wedge (blue). Currently, price action is located around a minor horizontal support, the 1.12330 area; and barriers to a southward movement include the wedge support (less than 30 pips away) and a major horizontal support at the 1.11300 area. Thus, bears may find it difficult to gain momentum for a southward continuation.

I may be wrong. Trade safe and prosper.
KP
The EURUSD market is operating in a descending channel (red) traceable to 2009. However, it has been in an ambivalent phase so far this year. After been stuck in a sideways operation since January 2019, the EURUSD market disposed southwards in March, printing a bearish continuation candlestick on the monthly time frame. Nevertheless, the lower shadow on the candlestick indicates that we may see bulls make some attempt to take price action northwards, much likely in the early part of April.
Attached Image (click to enlarge)
Price action is operating in a descending wedge (blue) on the weekly time frame. Last week, the market printed a bearish candlestick, which was a few pips shy of the wedge support line. The horizontal support is around the 1.11300 area, which is less than 100 pips from present location of price action. Therefore, we may see reduced bearish momentum until either after a northward pullback to an area of value or a breakdown of the 1.11300 area on at least a daily closing basis. Nevertheless, elementary wave analysis and other technicals favour the bears on a medium-term basis.
Attached Image (click to enlarge)
The daily time frame shows a market in a corrective phase of an impulsive downward trend. This operation is taking place in a descending wedge (blue). Currently, price action is located around a minor horizontal support, the 1.12330 area; and barriers to a southward movement include the wedge support (less than 30 pips away) and a major horizontal support at the 1.11300 area. Thus, bears may find it difficult to gain momentum for a southward continuation.
Attached Image (click to enlarge)
I may be wrong. Trade safe and prosper.
KP
Do your homework, follow the footprints of smart money