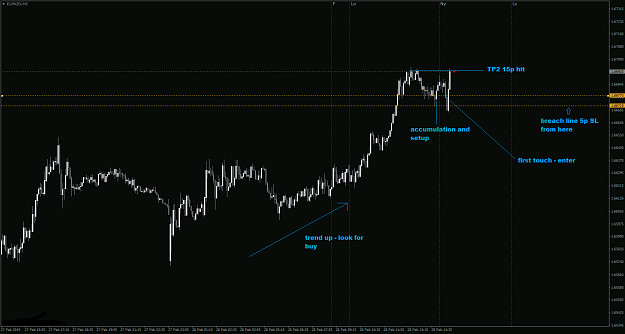
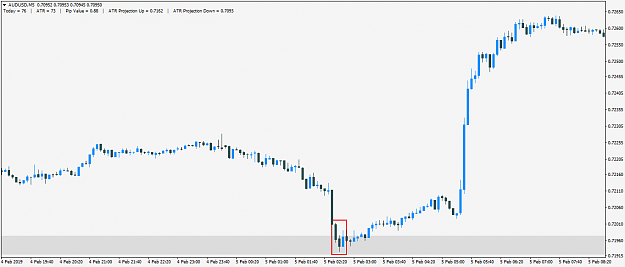
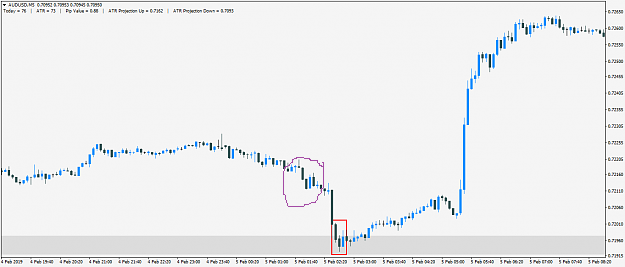
• Home
  • Forums
  • Trades
  • News
  • Calendar
  • Market
  • Brokers
  • Login
  • Join
  • User/Email: Password:
  • 12:58pm
Menu
  • Forums
  • Trades
  • News
  • Calendar
  • Market
  • Brokers
  • Login
  • Join
  • 12:58pm
Sister Sites
  • Metals Mine
  • Energy EXCH
  • Crypto Craft

Options

Bookmark Thread

First Page First Unread Last Page Last Post

Printable Version

Similar Threads

High Level Accuracy Method – “3-bar pattern Indicator/Alert” 256 replies

Tools for High Level Accuracy Method 7 replies

bo7a method... method for GBP/JPY 205 replies

MT4 Draw Symbol instead of Arrow, Draw n instead of square 2 replies

historical data accuracy puzzlement. 1 reply

  • Recycle Bin
  • /
  • Reply to Thread
  • Subscribe
  • 1,589
Attachments: High Level Accuracy Method With Little To NO Draw-down
Exit Attachments

High Level Accuracy Method With Little To NO Draw-down

  • Last Post
  •  
  • 1 149150Page 151152153 202
  • 1 Page 151 202
  •  
  • Post #3,001
  • Quote
  • Feb 28, 2019 6:10am Feb 28, 2019 6:10am
  •  Mitiblotch
  • Joined Sep 2017 | Status: Member | 4,586 Posts
Quoting FXCyborg
Disliked
{quote} OK, first, trend was up. 2nd, your spreads are probably higher than mine which is why I see 3rd bar engulfing them all 3rd, 30M there is no setup. 4th, 15M, there is no setup. 5th 5M there is a setup, but TP is hit (its the only counter trend setup found) 6th, 1M same as #5 So what does that tell us? No setup on a lower time frame directly under it is a good indication of a short lived setup, almost like a false positive. 7th, your accumulation zones, how many where there prior? remember the Elliot Wave Theory image I drew in? Those green...
Ignored
Thank you so much for the explanation. I really do appreciate it.

Yes, you have always screamed "setup within a setup". I'll pay attention to that next time. And you were right about the short-lived nature of that trade. I took it and booked few pips away from TP 1.
1
  • Post #3,002
  • Quote
  • Feb 28, 2019 6:12am Feb 28, 2019 6:12am
  •  calebfx
  • Joined Sep 2015 | Status: Member | 799 Posts
Quoting ricki72
Disliked
{quote} Hi Calbefx, if you look closer, you ll find another setup later: {image} And here you even find a setup within a setup in the time frame M5: {image} Now let´s hope the price to come back... I think this one is a good example (for newbies)!
Ignored
Yea good man I saw the accumulation. Let's see how it all plays out. Thanks

Edit: I never go below the 30 mins chart, matter of fact I do not trade using time charts, too much noise on there.
Read in between the price!!!
  • Post #3,003
  • Quote
  • Feb 28, 2019 6:14am Feb 28, 2019 6:14am
  •  calebfx
  • Joined Sep 2015 | Status: Member | 799 Posts
Quoting birdland
Disliked
{quote} he said that we need accumulation only on m1 and m5 setups. yours is a h1 setup, so you dont need accumulation.
Ignored
Oh really? Would you be kind enough to direct me to that post? Cheers
Read in between the price!!!
  • Post #3,004
  • Quote
  • Feb 28, 2019 6:19am Feb 28, 2019 6:19am
  •  FXCyborg
  • | Membership Revoked | Joined Nov 2014 | 1,911 Posts
Quoting calebfx
Disliked
{quote} Edit: I never go below the 30 mins chart, matter of fact I do not trade using time charts, too much noise on there.
Ignored
oh, this thread is for low drawdowns....

Maybe...Then you need to go on this thread if drawdowns is not too much of a problem?

https://www.forexfactory.com/showthread.php?t=888931
Advanced Price Action Trader -MY STUFF IS FREE! JOIN ME!
1
  • Post #3,005
  • Quote
  • Feb 28, 2019 6:48am Feb 28, 2019 6:48am
  •  steven21
  • | Joined Jun 2009 | Status: Member | 87 Posts
Quoting calebfx
Disliked
{quote} Oh really? Would you be kind enough to direct me to that post? Cheers
Ignored
Easy to find using search:
https://www.forexfactory.com/showthread.php?p=11977454#post11977454
1
  • Post #3,006
  • Quote
  • Feb 28, 2019 6:52am Feb 28, 2019 6:52am
  •  steven21
  • | Joined Jun 2009 | Status: Member | 87 Posts
Quoting calebfx
Disliked
Hey Mate cheers for the time taken to teach this on here. Okay so this trade looks like a juicy steak but unfortunately no accumulation of price can be seen on that level. So should we avoid the trade? {image}
Ignored
Imo, the 2 rectangular areas of sideway bars to the left and top-left of the setup are acc.
  • Post #3,007
  • Quote
  • Feb 28, 2019 7:03am Feb 28, 2019 7:03am
  •  acetrader
  • Joined Feb 2006 | Status: Member | 1,489 Posts
Quoting obiwandax
Disliked
{quote} A really, really good post, CrocodileRex. It covers so many aspects covering a whole gamut of issues. The thread-starter has offered up a method. That's all. He has made the mistake of allowing many, many posts covering pretty much every FX pair. I don't think it's fair on him to comment on such a wide range of pairs, and time-frames. And each trader brings with them their own biases and insights. It's probably the case that the non-ideal set-ups appear non-ideal only to the untrained eye. With years of experience, what is clear to FXCyborg...
Ignored


Not a ramble at all. Very spot on.
  • Post #3,008
  • Quote
  • Feb 28, 2019 7:37am Feb 28, 2019 7:37am
  •  gulaksarker
  • | Joined Dec 2013 | Status: Member | 34 Posts
USDCAD M15 sell setup.
Attached Image (click to enlarge)
Click to Enlarge

Name: Screenshot_6.jpg
Size: 111 KB


Trend seems down
Though its about to change
Attached Image (click to enlarge)
Click to Enlarge

Name: Screenshot_7.jpg
Size: 142 KB
Learn or earn, never lose!
1
  • Post #3,009
  • Quote
  • Feb 28, 2019 8:46am Feb 28, 2019 8:46am
  •  JeBrak
  • | Joined Feb 2017 | Status: Member | 112 Posts
EUR/NZD 5M. Explanation on chart
Attached Image (click to enlarge)
Click to Enlarge

Name: EURNZDiM5.png
Size: 67 KB
2
  • Post #3,010
  • Quote
  • Feb 28, 2019 8:46am Feb 28, 2019 8:46am
  •  pamc
  • Joined Jan 2017 | Status: Member | 1,156 Posts
Quoting FXCyborg
Disliked
{quote} First i said " of near" equal sizes. But I also said PREFERABLY equal And this is a counter trend setup in the image, lots of confluences there to warrant a Sell. Before any of you should attempt those, concentrate on the EW image I drew, it'll give people an idea where to get your buy and sell setup ideas from. Listen, Ladies & Gents, its like waiting for a bus, find the area where there are lots of people hanging around that area, is the trend going up? if so, then you could be looking at an accumulation zone where people are waiting...
Ignored


cul de sac
just in case you need to use it again.
  • Post #3,011
  • Quote
  • Feb 28, 2019 8:54am Feb 28, 2019 8:54am
  •  pamc
  • Joined Jan 2017 | Status: Member | 1,156 Posts
Quoting Metac
Disliked
{quote} Yes of course! Gbpusd is bullish in h4 and daily too. and the pattern made in H1 tf.{image}
Ignored

Metac you dont have a bullish engulfing the bearish 2 anywhere there. You would dowell togoback to the start and see the original posted images in first few pages and READ FXC's posts again. You will get it.
1
  • Post #3,012
  • Quote
  • Feb 28, 2019 9:12am Feb 28, 2019 9:12am
  •  Mitiblotch
  • Joined Sep 2017 | Status: Member | 4,586 Posts
FXC, I'm wondering if you'd take this trade. This setup wasn't tested since price left the area. And in one single 30 mins candle price is approaching the area.
Attached Image (click to enlarge)
Click to Enlarge

Name: PSX_20190228_152120.jpg
Size: 82 KB
  • Post #3,013
  • Quote
  • Feb 28, 2019 9:26am Feb 28, 2019 9:26am
  •  menek
  • | Joined May 2016 | Status: Member | 168 Posts
FXC, thank you for been around to answer questions. My understanding of this strategy is, 1. Identify the trend first, (for me on 1hr tf) then wait for the market to retrace 28-50% or 61.8% 2. Look for the 3 bar formation. 3. Drop to lower time frame preferably the 5m tf, look for the 3bar formation also and place your entry. This will give u low DD
1
2
  • Post #3,014
  • Quote
  • Feb 28, 2019 9:41am Feb 28, 2019 9:41am
  •  Sf85
  • | Additional Username | Joined Feb 2019 | 10 Posts
Quoting menek
Disliked
FXC, thank you for been around to answer questions. My understanding of this strategy is, 1. Identify the trend first, (for me on 1hr tf) then wait for the market to retrace 28-50% or 61.8% 2. Look for the 3 bar formation. 3. Drop to lower time frame preferably the 5m tf, look for the 3bar formation also and place your entry. This will give u low DD
Ignored
Looks good to me, but then again that's just me. I look for that all the time where an extreme hasn't been retested and take the trade. Usually works out for me. I call that formation the upside down mountian lol. Or likely properly called a bearish elliot wave or something. Correct me if I'm wrong please, still fairly new to this lol. Thanks!
  • Post #3,015
  • Quote
  • Feb 28, 2019 11:31am Feb 28, 2019 11:31am
  •  mubzaveri
  • | Joined Jan 2013 | Status: Member | 53 Posts
Hello sir
Please check attached image is my analysis correct or I am missing something...
Target at top red horizontal line
Stop below few pip of the setup low....
Attached Image (click to enlarge)
Click to Enlarge

Name: Screenshot_20190228-220023.png
Size: 168 KB
  • Post #3,016
  • Quote
  • Feb 28, 2019 1:32pm Feb 28, 2019 1:32pm
  •  pamc
  • Joined Jan 2017 | Status: Member | 1,156 Posts
Quoting mubzaveri
Disliked
Hello sir Please check attached image is my analysis correct or I am missing something... Target at top red horizontal line Stop below few pip of the setup low.... {image}
Ignored
as FXC has said many times, he wont respond to images that are not in the style that he has posted.i.e. full width and zoomed out images that show the whole previous and current structure. Properly labeled in the manner that he does.
Having said that, a zoomed in image may not show previous accumulation, the actual trend on that time frame. I assume you took the call trade off the upward trend line. So much info missing. should'nt need to guess. Make it clear as requested so many times by FXC.
1
  • Post #3,017
  • Quote
  • Feb 28, 2019 3:08pm Feb 28, 2019 3:08pm
  •  vvm
  • Joined Mar 2017 | Status: Member | 1,103 Posts
Help me Mates,

I cannot find BuySetUp on this Chart from FXC.
Post 361, 05.02.19

s. Chart

atb/vvm
Attached Image (click to enlarge)
Click to Enlarge

Name: 1.png
Size: 505 KB
PA Trading with 9,18 EMAs
  • Post #3,018
  • Quote
  • Feb 28, 2019 3:28pm Feb 28, 2019 3:28pm
  •  cablito
  • | Joined Jan 2011 | Status: Member | 83 Posts
Quoting vvm
Disliked
Help me Mates, I cannot find BuySetUp on this Chart from FXC. Post 361, 05.02.19 s. Chart atb/vvm {image}
Ignored
the set up within the setup
Attached Image (click to enlarge)
Click to Enlarge

Name: AUDUSDM5.png
Size: 22 KB
If a blind man leads a blind man, both will fall into a pit...
2
  • Post #3,019
  • Quote
  • Feb 28, 2019 3:50pm Feb 28, 2019 3:50pm
  •  vivaldi2
  • | Joined Jan 2019 | Status: Member | 108 Posts
Quoting cablito
Disliked
{quote} the set up within the setup{image}
Ignored
And why this one failed ?
Attached Image
  • Post #3,020
  • Quote
  • Feb 28, 2019 3:54pm Feb 28, 2019 3:54pm
  •  typhoon_gr9
  • | Joined Sep 2010 | Status: Member | 9 Posts
Quoting vivaldi2
Disliked
{quote} And why this one failed ? {image}
Ignored
I guess both are wrong setups, the price didn't move away and retest.
1
  • Recycle Bin
  • /
  • High Level Accuracy Method With Little To NO Draw-down
  • Reply to Thread
    • 1 149150Page 151152153 202
    • 1 Page 151 202
1 trader viewing now
  • More
Top of Page
  • Facebook
  • Twitter
About FF
  • Mission
  • Products
  • User Guide
  • Media Kit
  • Blog
  • Contact
FF Products
  • Forums
  • Trades
  • Calendar
  • News
  • Market
  • Brokers
  • Trade Explorer
FF Website
  • Homepage
  • Search
  • Members
  • Report a Bug
Follow FF
  • Facebook
  • Twitter

FF Sister Sites:

  • Metals Mine
  • Energy EXCH
  • Crypto Craft

Forex Factory® is a brand of Fair Economy, Inc.

Terms of Service / ©2021