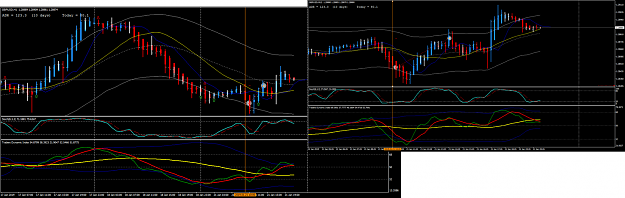
Attached Image (click to enlarge)
Maybe somebody could explain to me how to identify a VALID market condition for the M15 time frame and how such condition should has to look like for some M15 chart....
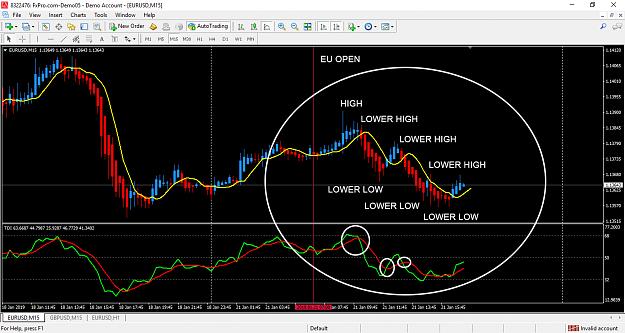
Is there some universal rule here where you can say that in this example market is in "consolidation" ?
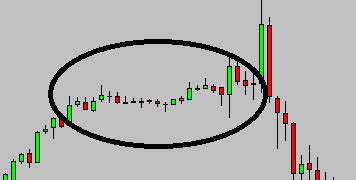
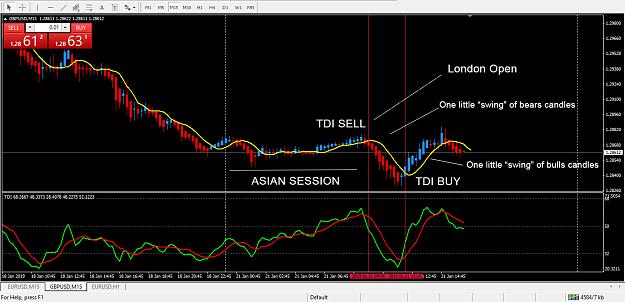
You can only look left to the the M15 chart here and see that between the asian session (which is overnight to me) nothing special happened. Price was moving in a tight range moving up/down for a few little pips. (No surprise...thats what its doing nearly always in the asian session).
Then the European session starts with Frankfurt/London Open and there are obviously two good TDI signals for either BUY or SELL.
So if the TMS strategy says i should only take signals in "trending markets" where are those trending market conditions explained? How does they have to look like?
I mean to me its just natural that during the asian session nothing much happens at all and that within the new day maybe something is cooking out, a new trend where you maybe see a series of higher highs and higher lows coming up next, but who knows?
So you have two options here in my understanding:
A) Wait until there is a series of new higher highs higher lows (uptrend) clearly visible printed on my M15 chart. So in its consequence this mean i would have to wait until all possible good TDI signals are over again and the new day starts before taking any action. So going to bed again without any pips booked in...
B) Take action on these two signals BUY and SELL because they might be just the start of a new trend for the day, or who knows when such "consolidation" is finally over?