Woke and found my 2 shorts at $10 profit after 10 hours. Closed them . Thanksgiving really did kill the market. Who thinks today will also be flat ?
Ignored
$10 is good, but what about your realise someone else made $100 on the same pair. See, I like scalping, but I would rather trade long term, if you don't want issues with brokers just trade long term,
{quote} $10 is good, but what about your realise someone else made $100 on the same pair. See, I like scalping, but I would rather trade long term, if you don't want issues with brokers just trade long term,
Ignored
So, what about Goldman and Morgan "scalping" billions of Dolars from Crypto currrency with the help of US Vice-President? Actually it was "dump and pump".
Now, come on man, nothing honest on this market. No need to give advise to small traders, also most brokers say scalping allowed anyway.
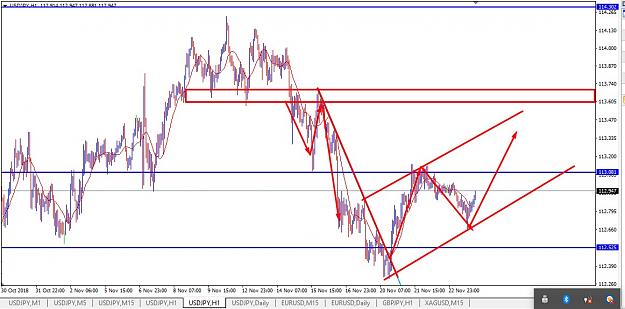
USD/JPY came under a modest selling pressure today and slumped to its lowest level of the day at 112.71 and currently is trading at 112.74. First support is seen at 112.60, ahead of 112.15 and 111.60. The upside offers resistances at 113.00 ,113.40 and 113.70.
{quote} $10 is good, but what about your realise someone else made $100 on the same pair. See, I like scalping, but I would rather trade long term, if you don't want issues with brokers just trade long term,
{quote} thanks man nice correlation there but which one is leading ? ofcourse us30y is leading but not sure how to use this information. It looks bearish overall trend
Ignored
Japan is the second largest foreign US bond holder, why? BY JPY holding US bonds, this maintains the value of the Yen, and ensures the close relationship for the forex pair, to maintain a trade deficit on Japans part. Considering the US is such a large trade partner, the JPY treasury value and the BOJ's unofficial mandate (IMO) is to maintain this relationship.
But with Trump planning to run massive deficits, this will push bond prices higher, as the US government looks to find more buyers, opposite of you're normal market. Less volume, higher prices. The key would be to determine the release schedule of the US Treasury but at least we get the Bond futures. Now this relationship isn't 100% but it can give a clear picture for the ship. Maybe not each wave, but the direction of the ship is set.
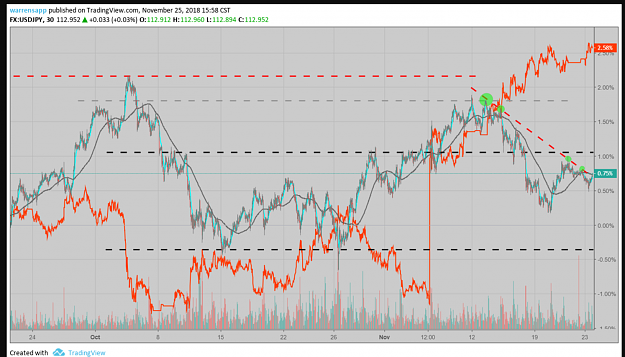
Something also to consider, when looking at Bonds and USDJPY zoomed out. USDJPY has some catching up to do, IMO. From the push up, of bonds prices at the last FOMC meetting USDJPY hasn't yet made up the percentage different. Eventually this will happen, just a matter of when. Look at the divergence between Bonds and USDJPY, UJ seems to be always playing catch up.
WE must remember, UJ likes to breathe more then any other pair and maintains a tighter daily range, then pretty much all fx pairs. This IMO is why so many come and go in this thread. USDJPY is a much different pair. IT breathes much of the time, not all the time but most of the time. Goes up some, down some, watch it breath, we must.
Bearish, it still looks, hmmm?
Attached Image(s) (click to enlarge)
Learn, a forex trader must, unlearn and relearn he will.
{quote} Japan is the second largest foreign bond holder, why? BY JPY holding US bonds, this maintains the value of the Yen, and ensures the close relationship for the forex pair, to maintain a trade deficit on Japans part. Considering the US is such a large trade partner, the JPY treasury value and the BOJ's unofficial mandate (IMO) is to maintain this relationship. But with Trump planning to run massive deficits, this will push bond prices higher, as the US government looks to find more buyers, opposite of you're normal market. Less volume, higher...
Ignored
Master Yoda,
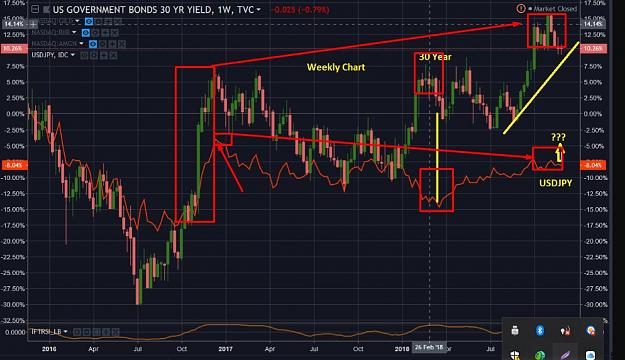
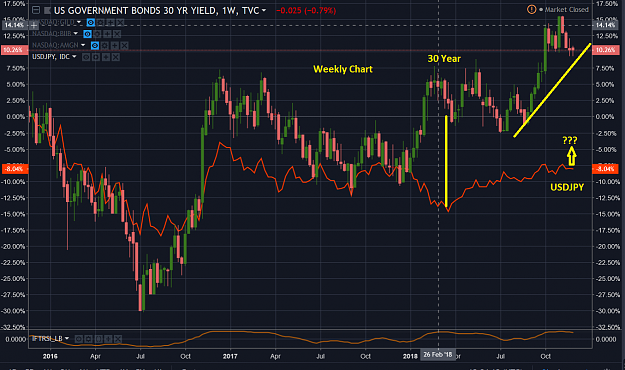
This is a weekly chart. Did i get it correctly. Critique much appreciated....
{quote} Master Yoda, This is a weekly chart. Did i get it correctly. Critique much appreciated.... {image} Thanks
Ignored
Yes perfect, aaven. The weekly shows it even better, it shows the run up from the Trump election, it shows how Bonds went higher but UJ has still remained far below the high set in Dec 2016. Then the push, from this October where Bonds now clearly are above the 2016 highs, Notice my 2 red angled lines, showing the divergence.
Attached Image (click to enlarge)
Learn, a forex trader must, unlearn and relearn he will.
{quote} Japan is the second largest foreign US bond holder, why? BY JPY holding US bonds, this maintains the value of the Yen, and ensures the close relationship for the forex pair, to maintain a trade deficit on Japans part. Considering the US is such a large trade partner, the JPY treasury value and the BOJ's unofficial mandate (IMO) is to maintain this relationship.
Ignored
I see the correlation you point out between us bonds and usdjpy - but i am confused by this paragraph from investopedia:
"The USD/JPY currency pair has traditionally had a close correlation with U.S. Treasuries. When Treasury bonds, notes and bills rise, USD/JPY prices weaken. The logic of investing in this currency pair is that the U.S. would never default on its bond obligations, providing a secure, safe havenstatus and ultimately making this allocation a long position."
...because to me, this reads that rising bonds weakens the USD/JPY price, which is the opposite of what you are saying - or are you saying the same thing?
I'm just confused, if you can explain some more, it would be appreciated.
{quote} Yes perfect, aaven. The weekly shows it even better, it shows the run up from the Trump election, it shows how Bonds went higher but UJ has still remained far below the high set in Dec 2016. Then the push, from this October where Bonds now clearly are above the 2016 highs, Notice my 2 red angled lines, showing the divergence. {image}
{quote} I see the correlation you point out between us bonds and usdjpy - but i am confused by this paragraph from investopedia: "The USD/JPY currency pair has traditionally had a close correlation with U.S. Treasuries. When Treasury bonds, notes and bills rise, USD/JPY prices weaken. The logic of investing in this currency pair is that the U.S. would never default on its bond obligations, providing a secure, safe havenstatus and ultimately making this...
Ignored
If your a Japanese investors, you can take a loan out for zero yen and then buy US bonds and make money. Hence the relationship Correlation. This relationship since 2015 when JPy bonds dropped significantly. I’m not sure investopedia has updated their explanation.
eseentially what bikov said using different words
Learn, a forex trader must, unlearn and relearn he will.
{quote} If your a Japanese investors, you can take a loan out for zero yen and then buy US bonds and make money. Hence the relationship Correlation. This relationship since 2015 when JPy bonds dropped significantly. I’m not sure investopedia has updated their explanation. eseentially what bikov said using different words
Ignored
The article I referenced said it was last updated on May 2018. Are there any other online resources you can point me in the direction to, to help me understand this better.
I do see on comparison charts, that often the u.s. bond price direction moves in the same direction as USDJPY, but not always.
EDIT:
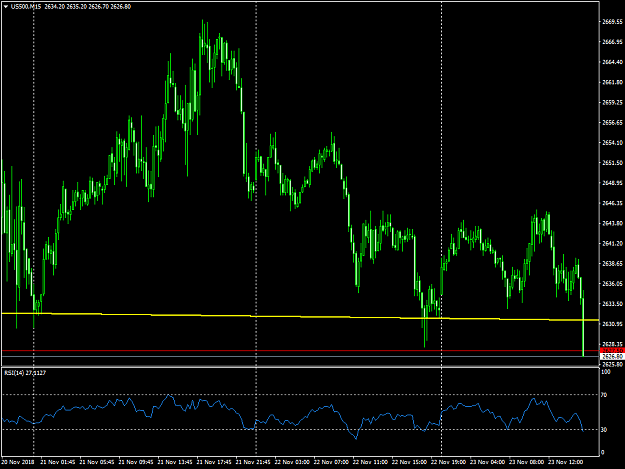
For example - this attached chart shows US10Y (orange line) moving in the opposite direction of USDJPY.
{quote} The article I referenced said it was last updated on May 2018. Are there any other online resources you can point me in the direction to, to help me understand this better. I do see on comparison charts, that often the u.s. bond price direction moves in the same direction as USDJPY, but not always. EDIT: For example - this attached chart shows US10Y (orange line) moving in the opposite direction of USDJPY. {image}
Ignored
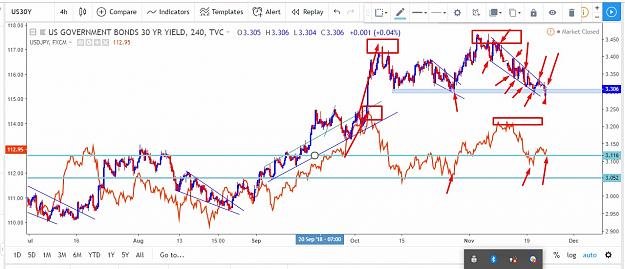
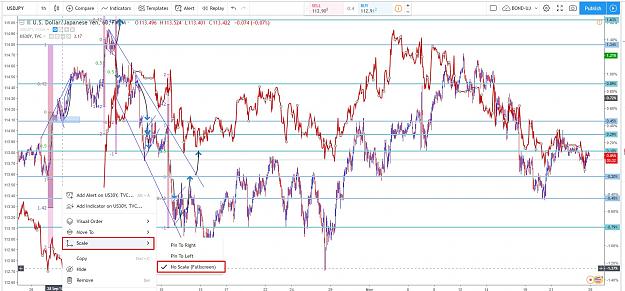
Whenever you add a comparison on a tradeview chart, set the line to "No Scale", left click the line>right click>Scale>No scale, you will then see the correlation much better. Just something to add not sure why their is the large spike up, November 6th roughly. This must be a gap in your tradeview data, Bonds didnt do that.
Attached Image (click to enlarge)
Learn, a forex trader must, unlearn and relearn he will.
{quote} Whenever you add a comparison on a tradeview chart, set the line to "No Scale", left click the line>right click>Scale>No scale, you will then see the correlation much better. Just something to add not sure why their is the large spike up, November 6th roughly. This must be a gap in your tradeview data, Bonds didnt do that. {image}
Ignored
Any reason why you use 30 year vs 10 year?
Is there a certain situation when it is better to use one than the other?
Going up as predicted . I already hit my TP on a Sunday. Have a good morning/night fellow Traders . Time to get some rest and recharge for the rest of the week .