Disliked{quote} Hi Jester Indicator Method was one of the first pdf's read. Something was not right from the word go. This would probably show how little I know. I understand that a wick: - show where price has been in the past before a bar is closed. - indicate that either sellers or buyers came in and push price back. - many wicks top or bottom indicate a change of direction is likely. Now which price action is right? - HA with "Strong Bar" / "Strong Sell" - Took the first google search web page with "forex what does a wick mean" (https://2ndskiesforex.com/trading-st...-forex-market/)...Ignored
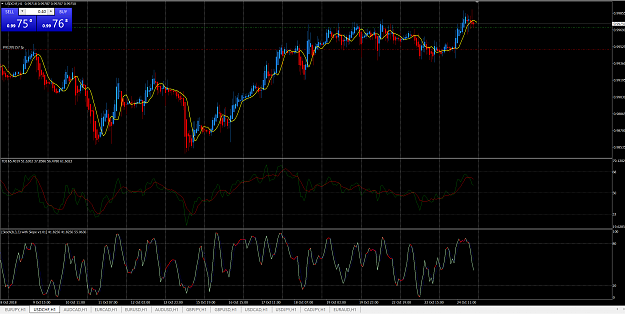
It may be an older version, but the rules are there. No angles, no top down. 1 chart and you just trade it. S i m p l e
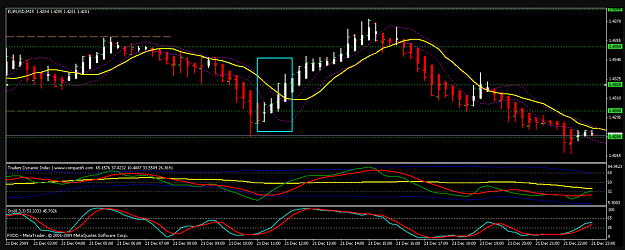
All I can say here is what my interpretation of the pdf is. And I looked at a number of these before I posted the pdf. Users can do their own backtesting and see the possibilities for themselves. At least they have the rules in one place. I would personally take a retest of the last 3rd of that HA candle that broke the low of that MA with a stop + 10 above it.
I would keep doing that in demo until I had a month of profitability, then I would go live. If not well, you know the answer.
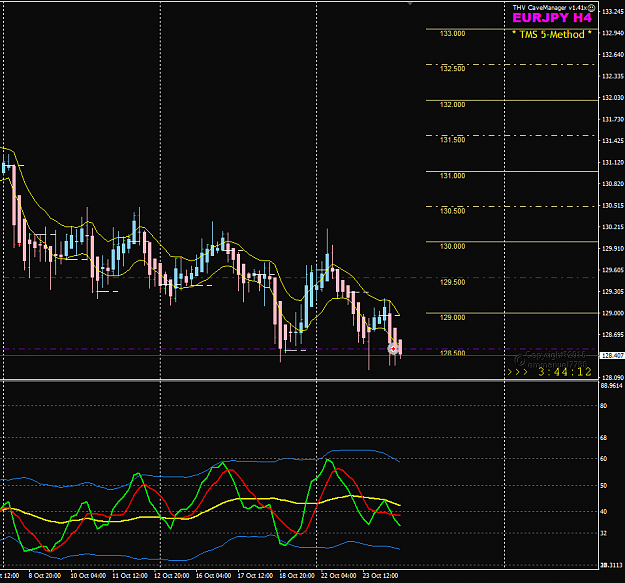
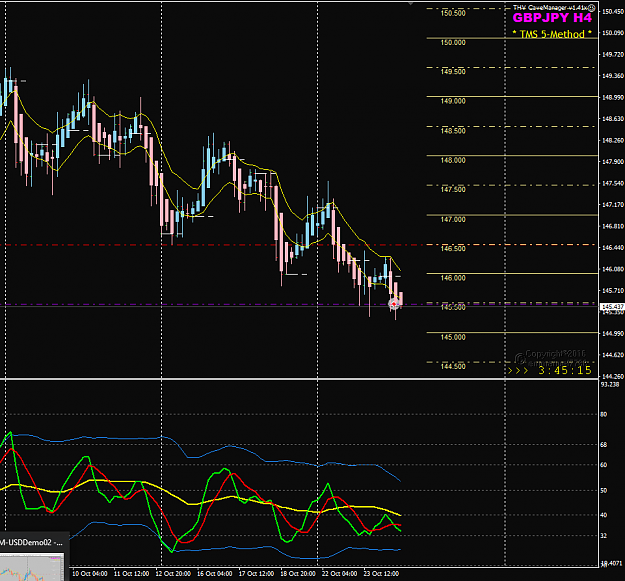
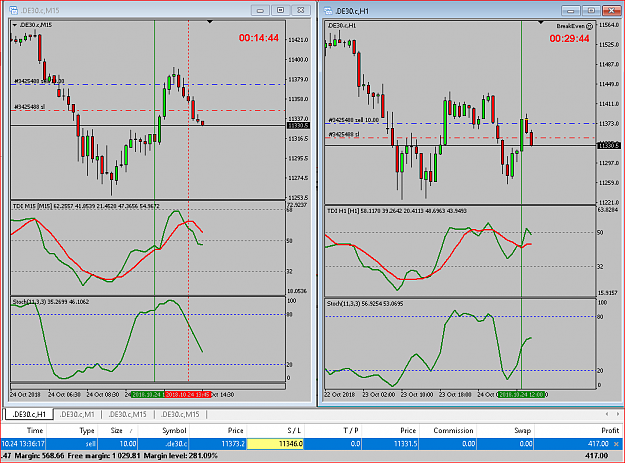
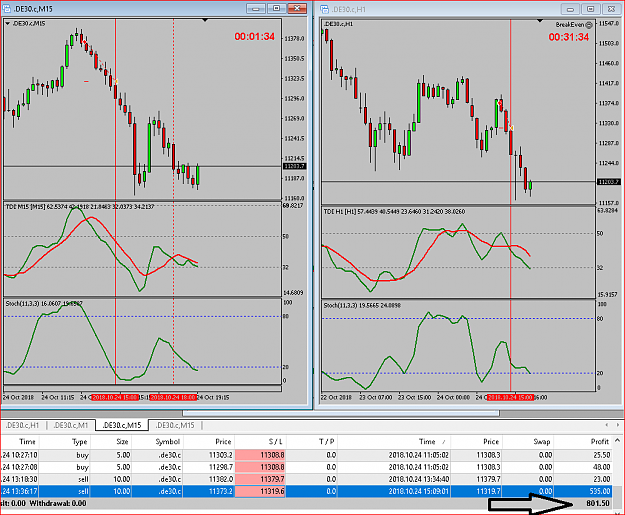
Here are 3 utterly simple signals
Yellow under 50
Tdi crossed
Candle closed under lower orange MA
Post results good or bad. If it doesn't work, walk away.
I can't see what more interpretation is required? A short with examples in 1 chart.
Attached Image (click to enlarge)
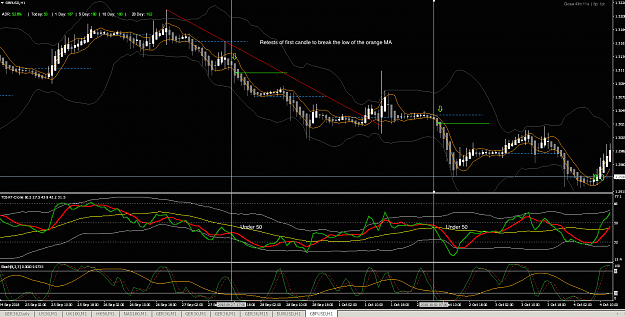
Edit: Why even bother with the stochastic? It is just another distraction that is not required when using the method in the pdf
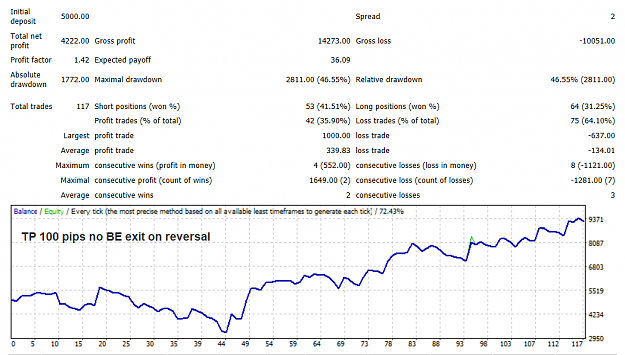
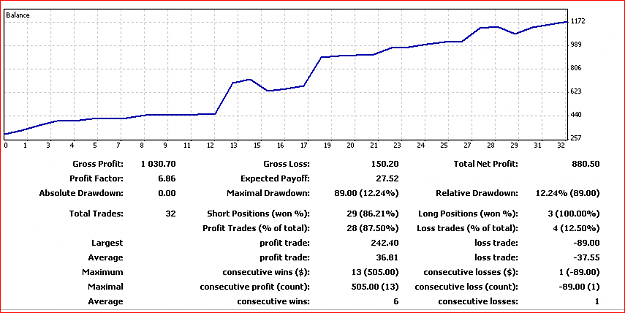
'in less than half an hour he made over 100 ticks'
2