{quote}My version: " The more time one spend looking at an indicator angle, the more time he has wasted and he will still be losing his hard-earned money trading retail forex".
Ignored
Always come back to the same old storie Emmanuel.
Why don't you start your own thread and leave this thread the way BigE has left it.
------
No reason or argument will justify what you are trying to do Emmanuel. When a member wants to trade the a indicator (any type) he will.
------
What I don't understand Emmanuel is the chart's you post's. You make the statement that all indicators are lagging and price action is the only way forward.
Then why don't post such chart's? (Some chart's are)
Pure price action does not use any information that a indicator provide. That mean just that: No ATR, RSI, MA and other indicators.
Which mean basically the indicator folder in the Navigator Panel is empty of those type of indicators.
DJ
Pun intended: How long do you stare at those two MA indicator's?
----------
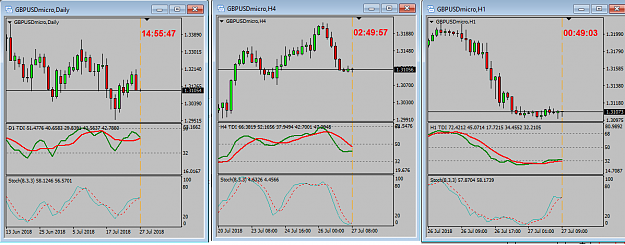
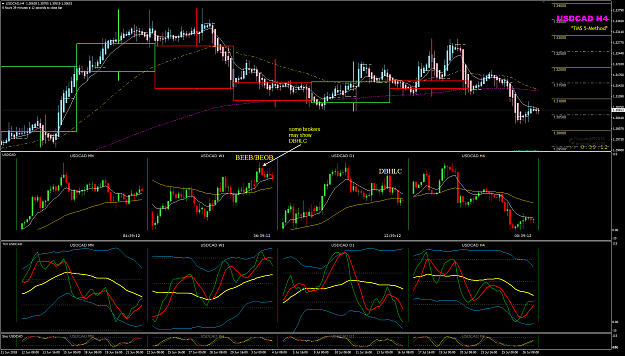
Too early.
- Green has not crossed red.
- Lower time frames show massive consolidation, support level, stoch wrong direction
A lot of reasons not to trade and to wait.
{quote} DJ Pun intended: How long do you stare at those two MA indicator's?
Ignored
Not long, just several seconds everytime new daily candle occured.
FYI, i dont trade the cross of those two MA's.
Im used those as "mean reversion".
Im used those as dynamic support resistance.
Im used those as confluence.
{quote} My Version The more time one spend looking at an indicator angle, the more time they have wasted not understanding the current market type therefore taking the wrong trades at the wrong time at the expense of there Equity.
Too early. - Green has not grossed red. - Lower time frames show massive consolidation, support level, stoch wrong direction A lot of reasons not to trade and to wait. {image}
Ignored
Yup too early, but i have different view to entry.
I used 50% retracement rule, so my risk will be smaller than my reward.
{quote} Not long, just several seconds everytime new daily candle occured. FYI, i dont trade the cross of those two MA's. Im used those as "mean reversion". Im used those as dynamic support resistance. Im used those as confluence.
Ignored
DJ
You not stupid.
------
What do you mean by those three point's DJ? I can not see how they can give those type of information.
Can understand:
crossover = change in trend direction.
Band's far apart = momentum
When they entwine each other = consolidation
{quote} DJ You not stupid. ------ What do you mean by those three point's DJ? I can not see how they can give those type of information. Can understand: crossover = change in trend direction. Band's far apart = momentum When they entwine each other = consolidation
Ignored
My answer is simple.
I dont want to debate about your chart and my chart.
Me and you have different view,
Me and you have different believe.
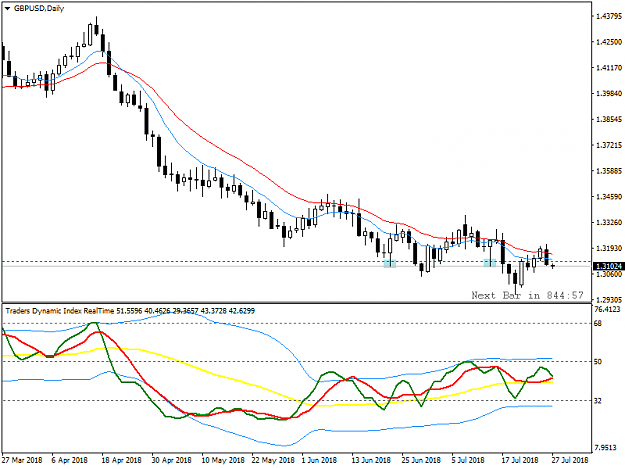
My view using those two MA's is price action is under that two MA's
So its downtrend, and as you can see those two MA's act as resistance in downtrend and also act as mean reversion in downtrend.
When i drop TDI to my chart, its clear, its downtrend.
RSI stay below 50 level, so its downtrend, as we know TDI is based on RSI.
So its same result about reading the trend, with using two different tools.
And now about entry timing.
You are used TDI, Stoch, and lower timeframe, and you said its too early.
For me its too early as well, but i used 50% retracement entry.
So its same result about timing entry, with using two different ways.
But im newbie, i can totally wrong about my words.
{quote} Yup, its good when trade TDI cross in same direction with main trend, but not always good decision. When trade TDI cross against the trend, is bad decision, but not always bad decision. Trading is probability game. How you win this probability game? For me, this is my tool, its called Risk Reward. Risk Reward is crucial. Risk reward is the most important aspect of trading. See table below, even with 30% of winner, can produce money bigger than 70% of winner. {image}
Ignored
on the 25% winning one you are forced to risk small percentages of your account or you will slip into huge drawdown sooner or later.
easy to get 20 losers in a row with that kind of winrate.
what will that do to your account if risking 2% or more per trade?
the 70% winner is superior as you will slip into less drawdown and can also safely risk more of your account per trade
{quote} {image} After 2 weeks, this starts to move below the Entry Price level. With some profits from the last 2 weeks, I can now start to scale-in more positions. {image}
Ignored
what was the price action that made you want to place trades here?
{quote} on the 25% winning one you are forced to risk small percentages of your account or you will slip into huge drawdown sooner or later. easy to get 20 losers in a row with that kind of winrate. what will that do to your account if risking 2% or more per trade? the 70% winner is superior as you will slip into less drawdown and can also safely risk more of your account per trade
Ignored
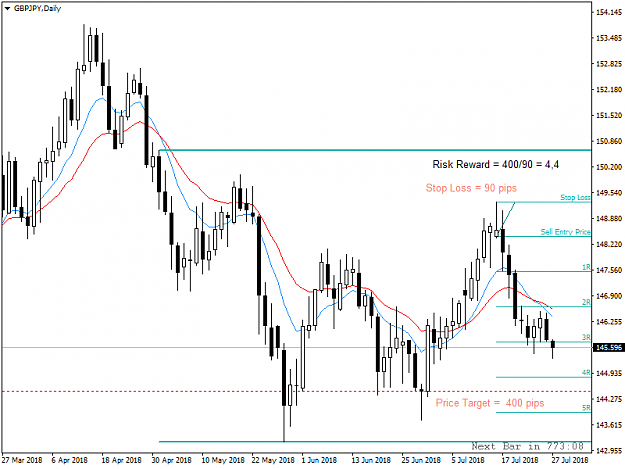
I think you had misconception about that risk reward.
Here example to explain those risk reward table.
I will take this pinbar trade if those trade give me atleast 2 times risk.
In this picture below, its give me potential profit 4,4 times risk to the price target.
So i will take that pinbar trade.
If we only looking trade with minimum 4 times risk, in 10 trade, and 7 is loser, we still make profit bigger than 1 times risk.
{quote} I think you had misconception about that risk reward. Here example to explain those risk reward table. I will take this pinbar trade if those trade give me atleast 2 times risk. In this picture below, its give me potential profit 4,4 times risk to the price target. So i will take that pinbar trade. If we only looking trade with minimum 4 times risk, in 10 trade, and 7 is loser, we still make profit bigger than 1 times risk. {image}
Ignored
If we only looking trade with minimum 4 times risk, in 10 trade, and 7 is loser,
we still make profit bigger than 1 times risk (7 win in 10 trade).
Hope this explain about that table of risk reward.
{quote} I think you had misconception about that risk reward. Here example to explain those risk reward table. I will take this pinbar trade if those trade give me atleast 2 times risk. In this picture below, its give me potential profit 4,4 times risk to the price target. So i will take that pinbar trade. If we only looking trade with minimum 4 times risk, in 10 trade, and 7 is loser, we still make profit bigger than 1 times risk. {image}
Ignored
This pinbar trade only example to measure risk reward.
That pinbar is not good example for entry.
these are common price bar patterns I use instead of saying small candle, big candle as in Post#647 which can be rather subjective, how small is small, how big is big, etc.
Attached Image (click to enlarge)
Attached Image (click to enlarge)
Honesty is a very expensive gift. You wont find it in cheap people.WBuffett
{quote} My answer is simple. I dont want to debate about your chart and my chart. Me and you have different view, Me and you have different believe. My view using those two MA's is price action is under that two MA's So its downtrend, and as you can see those two MA's act as resistance in downtrend and also act as mean reversion in downtrend. When i drop TDI to my chart, its clear, its downtrend. RSI stay below 50 level, so its downtrend, as we know TDI is based on RSI. So its same result about reading the trend, with using two different tools....
Ignored
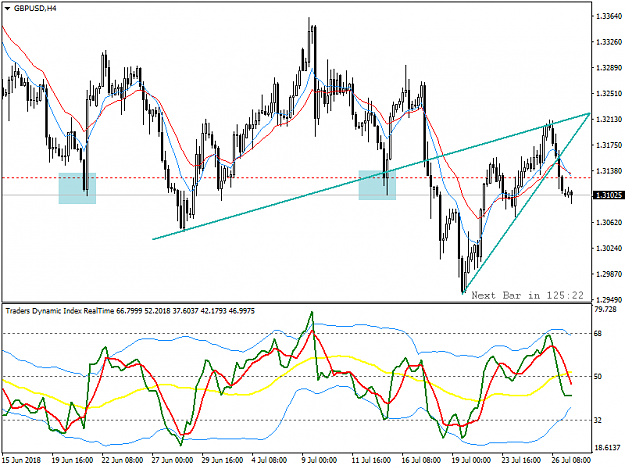
If you like MA crossover, Big E posted one in his old thread.
{quote} I think you had misconception about that risk reward. Here example to explain those risk reward table. I will take this pinbar trade if those trade give me atleast 2 times risk. In this picture below, its give me potential profit 4,4 times risk to the price target. So i will take that pinbar trade. If we only looking trade with minimum 4 times risk, in 10 trade, and 7 is loser, we still make profit bigger than 1 times risk. {image}
Ignored
If you want to improve your trades Risk:Reward, then you will have to consider Big E's
CONSERVATIVE entry and AGGRESSIVE exit.
This should increase your wins R-Multiples and your Expectancy.
If anyone still do not know what is Big E's CONSERVATIVE entry and AGGRESSIVE exit, then you have not read all his posts and taken notes of what he wrote.
Honesty is a very expensive gift. You wont find it in cheap people.WBuffett
{quote} If you like MA crossover, Big E posted one in his old thread. https://www.forexfactory.com/showthr...69#post4353069 But remember, #1 importance is the PA #2 is the TDI for confirmation of the price momentum. {image}
Ignored
Hi Emm,
I dont focused on MA crossover.
Im used those as "mean reversion".
Im used those as dynamic support resistance.
Im used those as confluence.
Agreed, #1 importance is the PA.
About #2 is the TDI for confirmation of the price momentum.
I dont used it anymore as confirmation, because every pinbar and engulfing always give same momentum on TDI.
So im take it down.
I think my chart is not relevant anymore here in TMS thread.
I just dont know where to post my chart.
Because im start in here, im keep posted here.
{quote} Hi Emm, I dont focused on MA crossover. Im used those as "mean reversion". Im used those as dynamic support resistance. Im used those as confluence. Agreed, #1 importance is the PA. About #2 is the TDI for confirmation of the price momentum. I dont used it anymore as confirmation, because every pinbar and engulfing always give same momentum on TDI. So im take it down. I think my chart is not relevant anymore here in TMS thread. I just dont know where to post my chart. Because im start in here, im keep posted here.
Ignored
Yes, experienced traders do not trade moving averages, indicator cross signals, etc.
we trade the price and its price action.
Honesty is a very expensive gift. You wont find it in cheap people.WBuffett