DislikedPASR {quote} Good for you Pete but.............your brain can only take in so much at a time so you have to practice and master what you have learned BEFORE moving on to the next topic. I suggest you start posting charts of your understanding of where you are at now with PASR. There are some really helpful people on here who have been where you are at now so will help you get over any hurdles you have.Ignored
Thank you for the invitation to post. Herewith my UsdJpy charts and analysis...
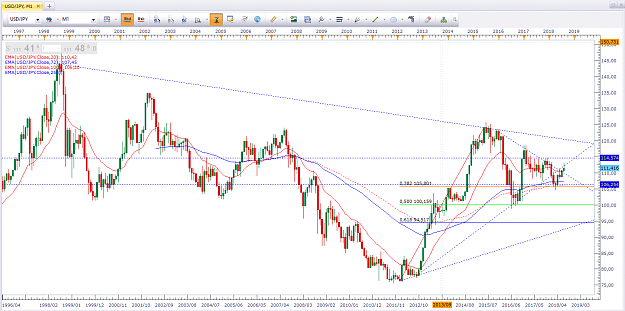
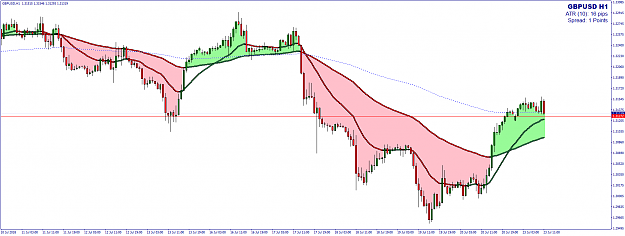
BigBoss:
Based on my chart and available data the Big Boss is in a long term downtrend / channel from 1998 ranging from 145ish to a low of 75ish. (Just rounding the numbers).
- From the LL in February 2012 UsdJpy is in a uptrend with the LH reached in June 2015 at the long term down TL at 125ish where the trend line was tested until December 2015 before it started retracing its tracks with a BEEB, a hanging man in January 2016 and then a huge BEEB in February establish the medium term down trend.
- Price bounced back up from SR and 50 Fib at 100ish (Round number), formed a LH, turned down and then bounced back up at 38fib and SR at 105ish (Round number again and PA hammer candle). The April BUEB confirmed the HL at this point and the short term uptrend commenced.
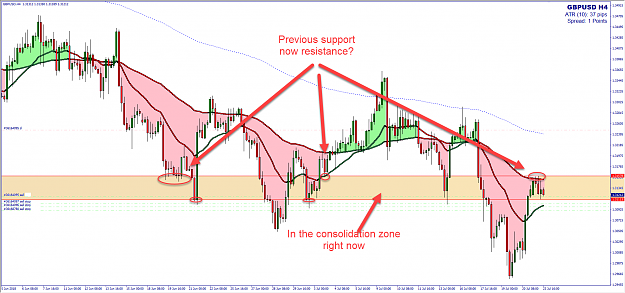
- Price has been consolidating in a triangle indicated by the demand and supply DSRI's on my chart.
- Significant for me is that the June BUEB candle closed above the 20MA and supply DSRI.
- I am watching the forming of the July candle with interest as July is 2 thirds gone and so far the price in July is above the 20 and the the Demand DSRI and seems so far to be respecting the supply DSRI.
Final analysis - short term trend is up.
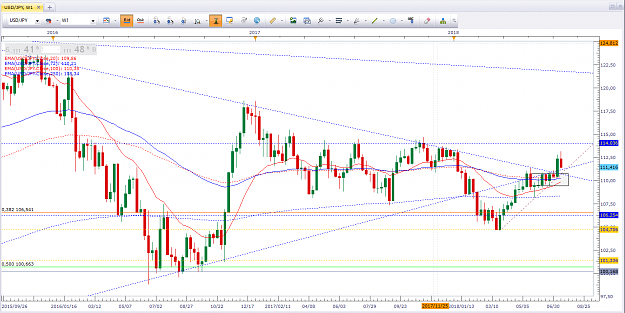
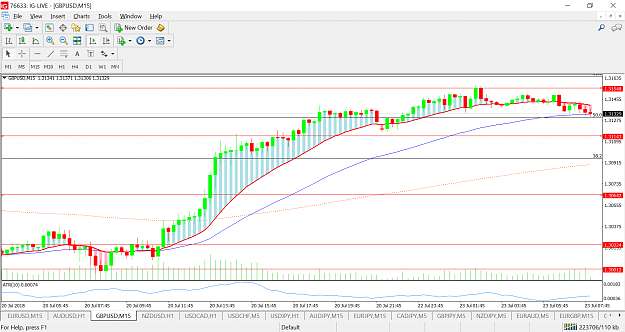
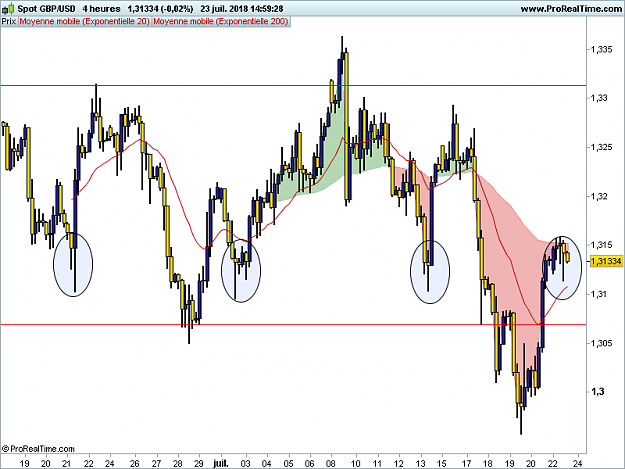
Boss:
On the Boss i am focussing my analysis on the very short term trend up from 105ish (Big Boss SR and 38 Fib level)
- Price is above the refined Demand and Supply DSRI lines as well as the short term TL.
- Price is also above the 20 and 50 MA although the the MA's are flat indicative of the sideways range bound movement of price between 105ish and 115ish. Price was progressively constrained in a tighter triangle formation.
- In my mind there is a confluence of trendlines and indicators just above the 110 level to 111 level. All seems to be pointing to a breakout from this zone.
- Price has closed outside the weekly control candle from May with a BUEB the week before and with an IB last week.
Final analysis - short term trend is up.
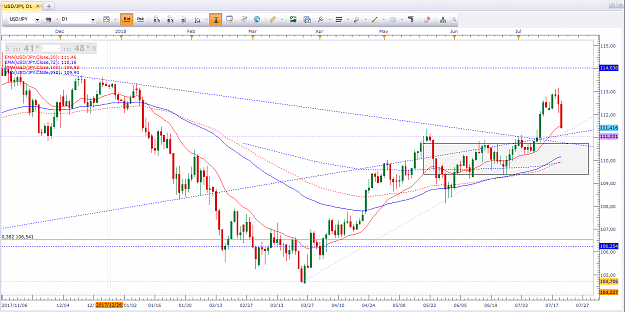
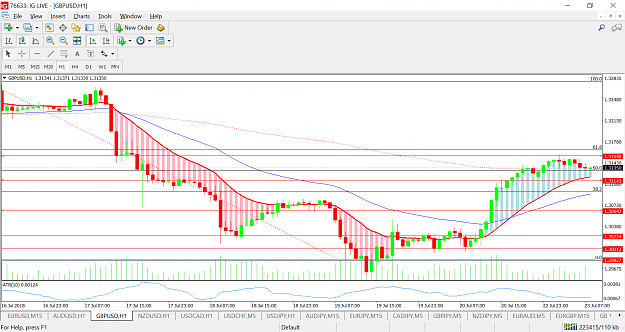
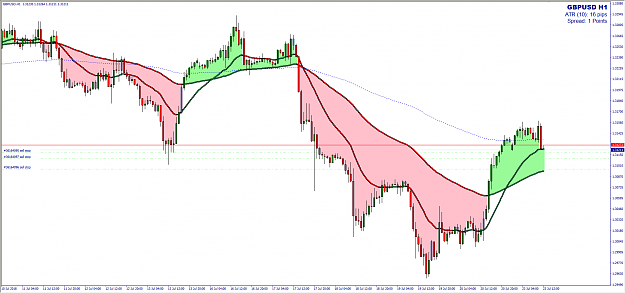
Worker:
Price is making progressive HH and HL from the 105ish low.
- Price is sitting on the 20MA just above the confluence of Tl's and SR at 111ish after breaking out from the weekly control candle zone and then dropping back down seeming to re test this level.
Final analysis - short term trend is up.
Conclusion:
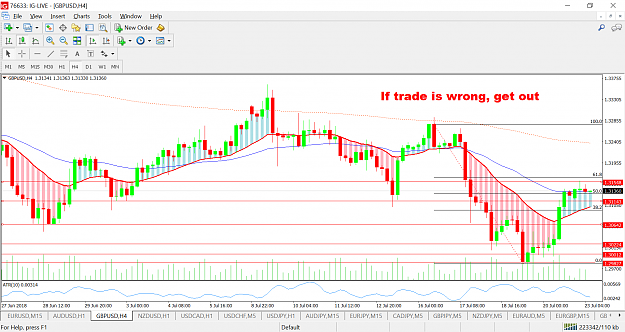
I will be watching to see If the 111ish level holds out and if it does I will be looking for favorable PA to go long to the next SR level of 114ish.
Attached Image(s) (click to enlarge)