Disliked{quote} If I'd have seen your charts I probably would have thought twice about an entry there but mine tell a different story. US close candles look totally different to your chart and to me look like we're in a consolidation area where I'm expecting price to drop after that big break below the support. This current H4 candle close for me will be the confirmation of that hopefully with a break and close below 1.31100. If not we'll still be in consolidation but price action looks bearish. Time will tell. I have a small entry to test the market in...Ignored
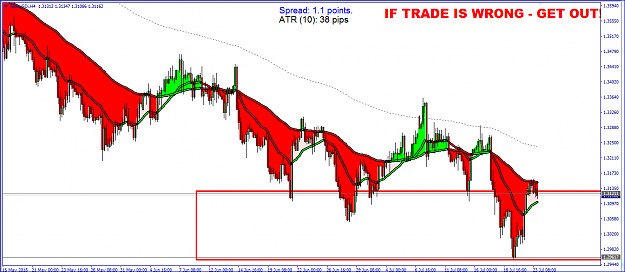
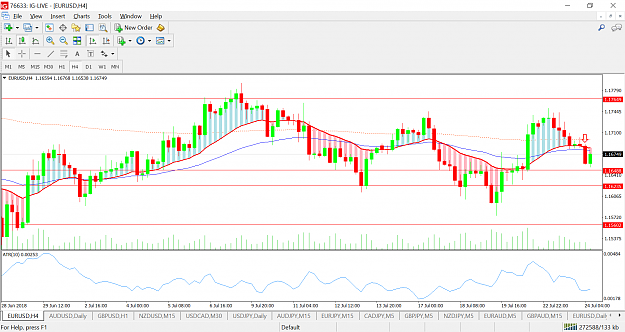
- H4 started initiating a swing low (TBC in my H4 in 2 hours)
- PA clearly down, so taking a short position is the safe bet
BUT
- Recent upwards push gives me pause
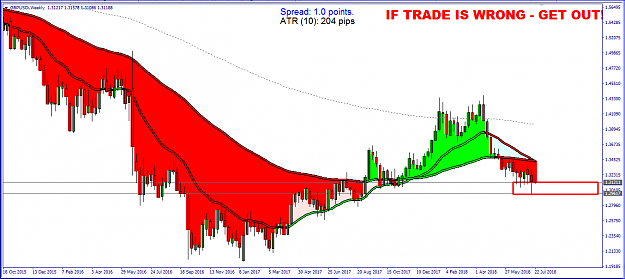
- Buyers at 1.3100 3-4 times in June/July
- I want to see price reaction on EMA 20 of H4 which is also about where buyers manifested themselves (1.3100 area)
So, even if I come in late, I will wait for reaction on 1.31 area and decide afterwards
I wish we had our own physical trading room to have these conversations, this is great stuff!
EDIT:
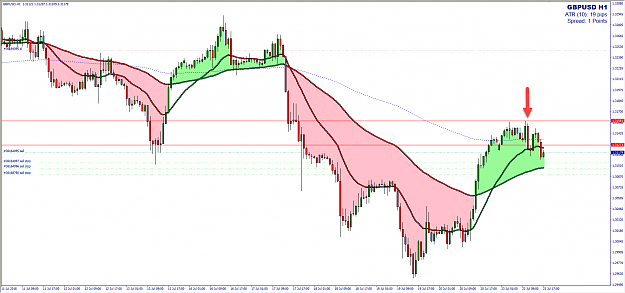
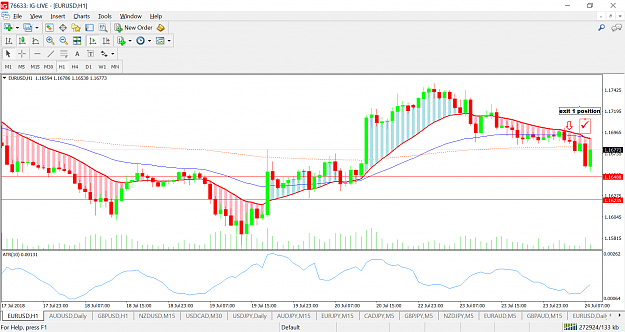
- When trading H4 swings on H1 positions, I noticed that reaction on EMA20 on both TFs is rather important
- I would not be selling GU if the H4 chart was an M5 chart, and you know that I am wired on M5 charts now, for better or worse