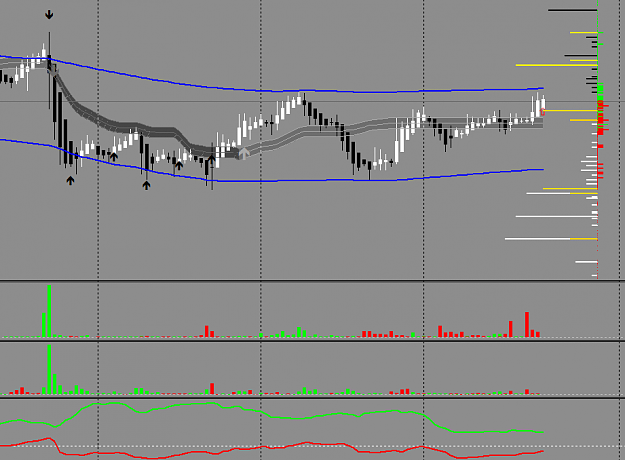
For the sloppy / lazy ones:
pink line = LT stop accumulation
yellow line above price = upper MT stop accumulation (yellow line BELOW price is LIMIT accumulation)
orange line below price = lower MT stop accumulation (orange line ABOBE price is LIMIT accumulation)
light blue line above price = upper ST stop accumulation
dark blue line below price = lower ST stop accumulation
green bar = DM long position accumulation
red bar = DM short position accumulation
black lines above the price = STS of DM shorties
white lines below the price = STS of DM longies
red / green lines in chart = SM levels / SM box (real SR & range)
IGNORE the grey ichimoku cloud and blue/yellow trend indi. These are NOT used for trading (only for orientation of the chart....helps when you look at many markets / screens at the same time).
Not explained yet:
red/green/blue channel lines in chart: DM MEDIAN levels
Another thing not explained yet:
yellow "step" in lowest historgram: SM Step
blue "step" in lowest histogram: SM Step
www.sme-fx.com
1