"Only you can Make the Future you will be proud to be a part of..." -Me
Request for a little bit of help with some Broker info - MT4 49 replies
A little more give back 20 replies
Does an EA license Give You the Right to Give Signals? 2 replies
Give me premise or give me death.... 15 replies
Are charts a little bit deceiving? 9 replies
Disliked{quote} Hi Mza55, IMHO, this is the right start. You want to measure an uptrend, so the orientation of 0.618 is up, but you measure the last extreme down candle ( including downwick ). Nut, if I'm wrong, please shoot me ... {image}Ignored
Disliked{quote} I still don't get it, why did u pick that candle? I understand the lowest low but previous high, why u picked the previous candle?Ignored
Disliked{quote} Dear raedmaa, 
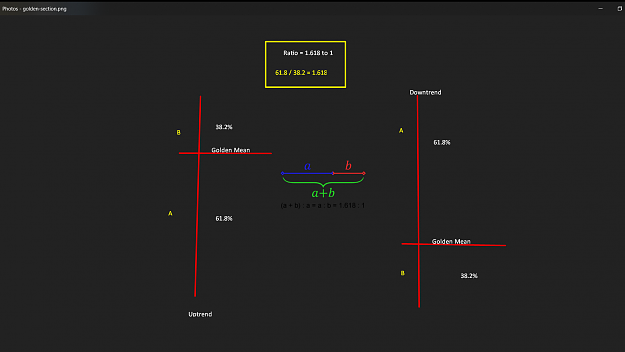
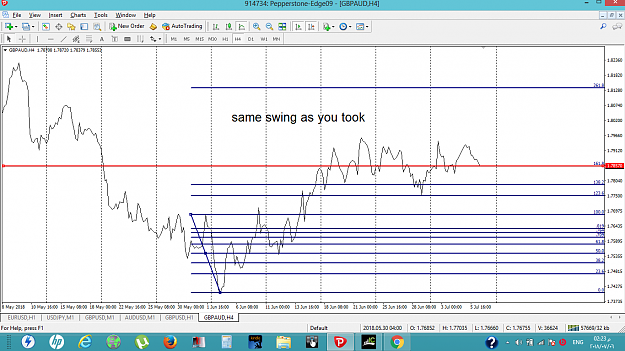
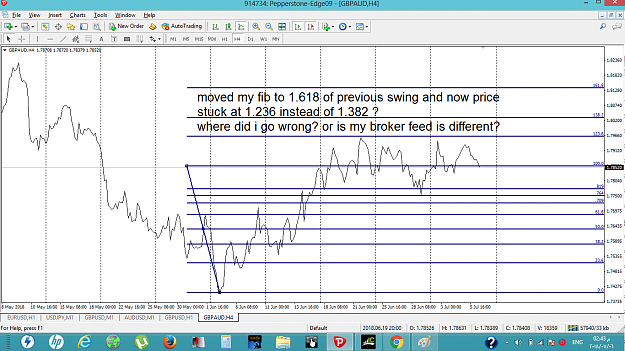
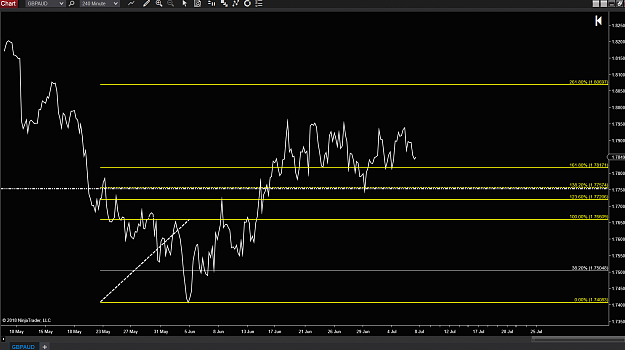
Thanks for posting those images, I was wondering how do you derive 0.709, 0.764 (3.23) and 0.819 as these are not standard fib numbers that I have encountered before. Are these custom fib ratios that you have projected and added values for? Why do you not use 0.786? I even looked up to the 5th derivative of golden mean and couldn't find matching numbers there. Best Regards, TzamoIgnored
DislikedI have been playing around with this method. Im still having issues finding my initial points, and end up just kind of fitting the levels to the graph instead of basing it off the initial datum. Im guessing it's a matter of practice and perhap experience. Here is EURCAD, 1H. Feedback would be greatly appreciated. {image}Ignored
DislikedSo now after the golden mean in the last chart it is reasonable to expect a further 38.2 expansion from the golden mean. The expansion can be seen in this chart. Price has become trapped at this level as the sheep stealers and horse rustlers battle it out. This 38.2% level is the defining point between the uptrend or downtrend. Have I cleared things up or baffled everybody. No offence intended but it may take a little time for the concept take hold. {image}Ignored
Disliked{quote} This is what I get on EURCAD in three steps.{image}{image}{image}Ignored
DislikedNow if I place my fibs on length 1 then I get a golden mean either above or below my zero line. Depending on my view of the market depends upon which golden mean I choose. {image} {image}Ignored
Disliked{quote} I wonder if it is ok to choose the 1st wave up just right after wave AB in the image as the initial starting range? Thanks.Ignored
DislikedSo now after the golden mean in the last chart it is reasonable to expect a further 38.2 expansion from the golden mean. The expansion can be seen in this chart. Price has become trapped at this level as the sheep stealers and horse rustlers battle it out. This 38.2% level is the defining point between the uptrend or downtrend. Have I cleared things up or baffled everybody. No offence intended but it may take a little time for the concept take hold. {image}Ignored
DislikedHi all I began trading circa 1984 and am now winding down except for a little spread betting to keep my hand in. This made me consider what brought success in trading, luck(no), following market news(no), accurate price targets(yes). So this thread is to show people how I did it using Fibonacci. Now don't get bored already I am not going into the sex lives of rabbits or sunflowers etc. The methods describe in all the books are in my view no more than garbage. Having been through all the dramas rookie traders experience I decided this is the best...Ignored