Lassame. Thanks for your reply. I appreciate your message! What is your suggestion to improve this system? How do you think we could tweak to use statistical information in trading?
Test case:
By demonstrating a 50 -50 ratio just by calculating red and green candles on M1 for the past 20 years and you can see that it will be much more candles in 1 type than on the other, way past a reasonable distribution, so in either way its biased. But to say random, i agree. BTW the gold and silver is upward biased more than 35% than the equilibrium, thats not a coincidence, but the seed of candlesticks is probably a true random sequence.
Question:
- how do we define:
1. a biased market
2. a coincidence in the market
3. a random price direction?
[quote=michaellobry;11119623]Trading system: wick system 1.00 Type: trend and ranged Timeframe: M1 - D1. In this example we take the H1 chart. Entry: - when: in the H1 chart buy or sell on every candle (this means, every hour you will open an order at exactly close of previous candle). - buy: if lower wick of previous candle is bigger than the upper wick. - sell: if lower wick of previous candle is smaller than the upper wick. - TP/SL: 50 pips Stati
Hi, i trade using statistics and to be precise Frequency Distribution...
i am not here to be negative and you may have something with the wicks?
But the only way to trade is follow the market makers and especially after the uk & us open. volatility is king.
Keeping stats opens your eyes as to what the market movers are up to OR playing.
SEE LINE,TRADE LINE..PRICE HAS TO GO SOMEWHERE,,, PRICE WILL GO SOMEWHERE.
https://www.oanda.com/forex-trading/...ers-statistics
Top 100 Forex Traders Statistics. These statistics are calculated from the forex trading activities over the past 24 hours of two groups of OANDA traders: the top 100 "most profitable" and (optionally) the top 100 "least profitable" traders.
For the readers of this thread, please state your opinion.
Trading system: wick system 1.00 Type: trend and ranged Timeframe: M1 - D1. In this example we take the H1 chart. Entry: - when: in the H1 chart buy or sell on every candle (this means, every hour you will open an order at exactly close of previous candle). - buy: if lower wick of previous candle is bigger than the upper wick. - sell: if lower wick of previous candle is smaller than the upper wick. - TP/SL: 50 pips Stati Hi, i trade using statistics and to be precise Frequency Distribution... i am not here to be negative
Ignored
...
Ignored
"the only way to trade is follow the market makers and especially after the uk & us open. volatility is king. Keeping stats opens your eyes as to what the market movers are up to OR playing"
Fantastic Billy. 100% in agreement with what you said in bold.
Please share a little bit more on "Frequency Distribution". These two are my 2nd and 3rd favorite words too (after "Time").
EDIT - Currently I trade round the clock but my stats tell me trading Asian volatility is not consistent with my understanding of what happens at London and US open. Is that also your experience? especially with AUDXXX and JPY crosses. The Asian MMs use some different techniques or influences making it hard to follow the flow in what I am seeing.
Trading system: wick system 1.00 Type: trend and ranged Timeframe: M1 - D1. In this example we take the H1 chart. Entry: - when: in the H1 chart buy or sell on every candle (this means, every hour you will open an order at exactly close of previous candle). - buy: if lower wick of previous candle is bigger than the upper wick. - sell: if lower wick of previous candle is smaller than the upper wick. - TP/SL: 50 pips Stati Hi, i trade using statistics and to be precise Frequency Distribution... i am not here to be negative
Ignored
...
Ignored
@Billy:
I agree with VEEFX. Billy, could you explain in more detail regarding FD?
What is FD:
- Frequency Distribution is well explained here:
Inserted Video
. More links are welcome.
- more and more python traders integrate FD in their system and make use of Taylor's (or Rela's) perspective (https://books.google.nl/books?id=l7WJTcbxcmQC&pg=PA173&lpg=PA173&dq=taylor+vs+rela+"frequency+distribution"&source=bl&ots=1Uu_p45jyR&sig=qVTqwwm_nTdYt2J2RzIXzY093zc&hl=nl&sa=X&ved=0ahUKEwjm_4SS-fbbAhXPGuwKHSWeAbsQ6AEISjAI#v=onepage&q=taylor%20vs%20rela%20"frequency%20distribution"&f=false)
- Frequency distributions are typically used within a statistical context.
- "The frequency chart is referred to as a point-and-figure chart and was created out of a need for floor traders to take note of price action and to identify trends. The y-axis is the variable measured, and the x-axis is the frequency count. Each change in price action is denoted in X's and O's. Traders interpret it as an uptrend when three X's emerge; in this case, demand has overcome supply. In the reverse situation, when the chart shows three O's, it indicates that supply has overcome demand." (https://www.investopedia.com/terms/f...stribution.asp and https://www.investopedia.com/terms/p...igurechart.asp)
How to trade FD:
Regarding how you trade FD, I presume you are using FD tools and indicators:
- like attached below
- order block (tools) (like
Inserted Video
)
- CoT (to replace volume distribution):
Inserted Video
- trading SB waves instead of Barros Swings
- FD trading in other ways:
*1) to find the wick sizes in pips
2) categorise them into the different sizes:
- 0-1 pips
- 1-5 pips
- 5-10 pips
- 10-20 pips
- 20-100 pips
- the tool counts all the wicks of the previous 240 h4 candles (2 months of data). Then the average of the 240 candles. And count the body of the h4 candles and average it out.
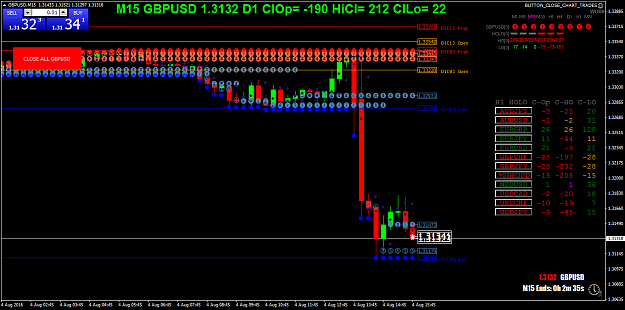
It will give the stats on how many candles close green & red 1 , 2, 3, 4, 5, 6, etc times in a row in the last x amount of candles.
Example:
100 (will use much bigger sample size in practice) candles Sample
100% Close Green or Red 1 Day in a row
50% Close Greeen or Red 2 days in a row
20% Close Green or Red 3 Days in a Row.
15% close green or red 4 days in a row.
10% close green or red 5 days in a row.
5% close green or red 6 days in a row.
Frequency distribution indicator. It will give the stats on how many candles close green & red 1 , 2, 3, 4, 5, 6, etc times in a row in the last x amount of candles. Example: 100 (will use much bigger sample size in practice) candles Sample 100% Close Green or Red 1 Day in a row 50% Close Greeen or Red 2 days in a row 20% Close Green or Red 3 Days in a Row. 15% close green or red 4 days in a row. 10% close green or red 5 days in a row. 5% close green or red 6 days in a row. {image} {file}
Ignored
Do you have the source code to share for this indicator?