No problem. Thank you clusterwise!
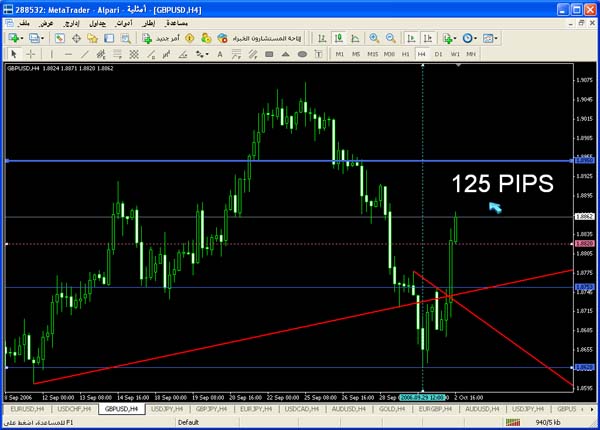
Quoting ClusterwiseDislikedIt's just the same way that you pick your demand/support Trend. you scan the chart to pick those points where the price were declined and it formed a candel it's high higher that the two candels to the right/left of that candel. Actually Demand line = based on two resistance points
Support Trend = based on two supoort points.
thanks for the link and the helpIgnored