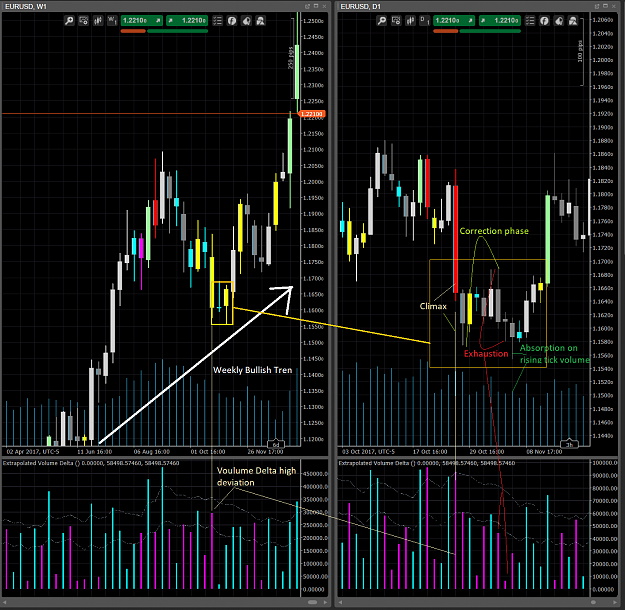
Disliked{quote} The indicator is at the bottom of the chart (histogram with arrows - I put there three yellow arrows to point at the indi's signals). On first sight might be useful when paired with a couple of MAS or Hull Averages to show trend, green ones are false signals in a downtrend so should be filtered. The arrows on the main screen (white, yellow and red) come from my volume indicator, I am trying to make it better (I aim to have an indi showing me the end of a correction with good reliability and precision, and then to build a scanner showing...Ignored
Thus placing meaning on these intraday volume pulses can have some disastrous effects on your account balance. I reiterate my caution here again...if you want to trade intraday on small time frames do it on a market with centralized and transparent data. Then YES, by all means use volume to help you find your perfect entry/exit points.
I cannot stress this enough, yet no one here seems to comment on it or heed this advise...and we are always seeing this theory applied to small time frames in FX trading...I dare say it is dangerous especially when using retail brokers that also provide you the data...and are the counter party to your trades...please be careful with this...
@xxxx§|[::::::::::::::::>
1