• Home
  • Forums
  • Trades
  • News
  • Calendar
  • Market
  • Brokers
  • Login
  • Join
  • User/Email: Password:
  • 11:46pm
Menu
  • Forums
  • Trades
  • News
  • Calendar
  • Market
  • Brokers
  • Login
  • Join
  • 11:46pm
Sister Sites
  • Metals Mine
  • Energy EXCH
  • Crypto Craft

Options

Bookmark Thread

First Page First Unread Last Page Last Post

Print Thread

Similar Threads

S&P500 Futures Talks & Ideas 217 replies

ECN && STP && Scalping && Hedging - Broker Review - Oct 2009 24 replies

s&p500 and gold Risk ON/OFF Price action trading 34 replies

E-mini S&P500 futures - buy underlying & put option 14 replies

S&P500 (mini) 6 replies

  • Interactive Trading
  • /
  • Reply to Thread
  • Subscribe
  • 456
Attachments: S&P500 trading
Exit Attachments
Tags: S&P500 trading
Cancel

S&P500 trading

  • Last Post
  •  
  • 1 1415Page 161718 48
  • 1 15Page 1617 48
  •  
  • Post #301
  • Quote
  • Mar 1, 2018 11:15am Mar 1, 2018 11:15am
  •  JR97
  • Joined Apr 2004 | Status: #slack pricetimeforecast | 1,934 Posts
Added more SP short shares on the pull back to 2734.00 This time with SPXU (ProShares UltraPro Shrt S&P 500 ProShrs)

Also banked an SP Nadex put for $26 net per on a $24 buy in on an OTM 2710 strike.

http://content.screencast.com/users/...0Mar.%2001.gif
 
 
  • Post #302
  • Quote
  • Mar 4, 2018 4:32am Mar 4, 2018 4:32am
  •  MoneyFocus
  • | Membership Revoked | Joined Aug 2017 | 2,302 Posts
Interesting thread!


  • Post #303
  • Quote
  • Mar 7, 2018 12:33pm Mar 7, 2018 12:33pm
  •  JR97
  • Joined Apr 2004 | Status: #slack pricetimeforecast | 1,934 Posts
2 day retrace is done? Shorted intraday with a nadex spread and then a nadex binary and both cashed. I was pretty early on the spread and had to sit in the red until the gap was filled and the trendline hit. But that gave the opportunity to get an ATM put binary option 2721 strike to cover the spread and then some.

spread entry: http://content.screencast.com/users/...0Mar.%2007.gif
binary entry and exit area for both:
http://content.screencast.com/users/...0Mar.%2007.gif

ETF's still in profit but gave some back on the 2 day retrace. No biggie since this is a longer term position. will look to add more to the ETF's if there's a retrace today.
 
 
  • Post #304
  • Quote
  • Mar 8, 2018 12:42pm Mar 8, 2018 12:42pm
  •  JR97
  • Joined Apr 2004 | Status: #slack pricetimeforecast | 1,934 Posts
Quoting JR97
Disliked
2 day retrace is done? Shorted intraday with a nadex spread and then a nadex binary and both cashed. I was pretty early on the spread and had to sit in the red until the gap was filled and the trendline hit. But that gave the opportunity to get an ATM put binary option 2721 strike to cover the spread and then some. spread entry: http://content.screencast.com/users/...0Mar.%2007.gif binary entry and exit area for both: http://content.screencast.com/users/...0Mar.%2007.gif...
Ignored
Pretty hefty retrace. Adding on. There's also a wolfe wave in the chicken coop.

http://content.screencast.com/users/...0Mar.%2008.gif
 
 
  • Post #305
  • Quote
  • Mar 8, 2018 5:24pm Mar 8, 2018 5:24pm
  •  Squiggles
  • Joined Nov 2014 | Status: Member | 1,731 Posts
Quoting JR97
Disliked
{quote} Pretty hefty retrace. Adding on. There's also a wolfe wave in the chicken coop. http://content.screencast.com/users/...0Mar.%2008.gif
Ignored
 
 
  • Post #306
  • Quote
  • Mar 10, 2018 1:48pm Mar 10, 2018 1:48pm
  •  mihrutkanik
  • | Joined Jan 2014 | Status: Member | 137 Posts
Ok. Don't know if intraday short all right or not, but long term I'm still bullish.
 
 
  • Post #307
  • Quote
  • Mar 24, 2018 4:31pm Mar 24, 2018 4:31pm
  •  mihrutkanik
  • | Joined Jan 2014 | Status: Member | 137 Posts
It seems like correction up to 2240.
 
1
  • Post #308
  • Quote
  • Mar 24, 2018 4:36pm Mar 24, 2018 4:36pm
  •  MoneyFocus
  • | Membership Revoked | Joined Aug 2017 | 2,302 Posts
Nice to see a S&P 500 trading thread!
 
 
  • Post #309
  • Quote
  • Mar 26, 2018 5:29am Mar 26, 2018 5:29am
  •  mihrutkanik
  • | Joined Jan 2014 | Status: Member | 137 Posts
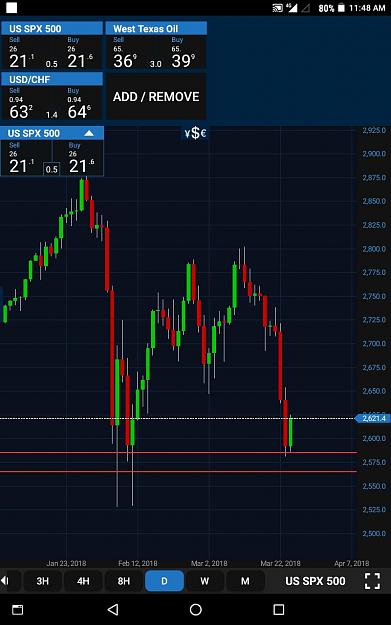
I wanna summarize my thoughts.
I have already painted cycles and assess the prospects for Americans positively. However, I do not exclude the correction down, the goal indicated 2240. At the moment, the index above support (the zone is red lines). Pass it or not? It's not obvious, this is another factor to look positively at the SP 500.
Attached Image (click to enlarge)
Click to Enlarge

Name: Screenshot_2018-03-26-11-48-53.jpg
Size: 131 KB
 
 
  • Post #310
  • Quote
  • Apr 2, 2018 5:11pm Apr 2, 2018 5:11pm
  •  Plenov
  • Joined Oct 2015 | Status: Member | 152 Posts
The first trading day of the second quarter was the worst for the S&P 500 since 1930! Both US blue chip indexes - the S&P 500 and Dow - fell below the 200-day MA.

It seems that over a long weekend investors have become stronger in their determination to sell shares, which they did as soon as the market opened. They are difficult to blame for this, since most good news is left behind, and bad ones grow like a snowball. Last weeks were marked by a sharp increase in the spread of Libor-OIS, which determines the cost of short-term financing and affects everything from the cost of bank lending to marginal costs of debt in trillions of dollars with a floating rate. He has a particularly strong influence on the company's plans to redeem his shares, which was one of the main drivers of the growth of the US stock market in recent years.

As part of the inflaming trade war, China reported on the response to the protection of the White House, imposing additional duties on 128 American goods. Another blow to the market caused by Apple, reporting on plans to abandon the use of Intel components in their computers, which by the results of the auction sent the shares of the latter down 6%. Shares of Amazon lost 5% amid escalation of rhetoric of Donald Trump regarding the company. As a result of these events, the S&P 500 closed for the first time in the last 442 days (since Breckzit in June 2016) below the 200-day MA
 
1
  • Post #311
  • Quote
  • Apr 3, 2018 6:59am Apr 3, 2018 6:59am
  •  aariapoor
  • Joined Jun 2016 | Status: Forexian | 316 Posts
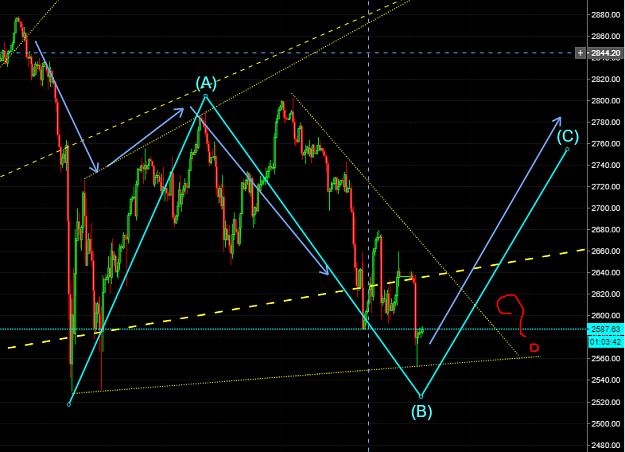
Was it rushing to finish the B wave?

Attached Image (click to enlarge)
Click to Enlarge

Name: Screenshot1.png
Size: 90 KB


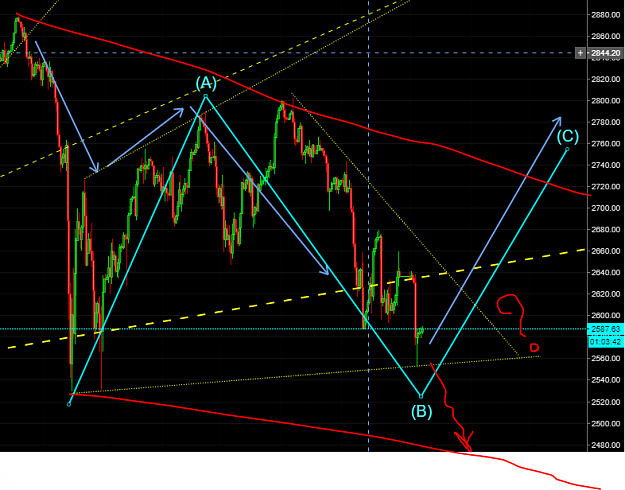
Is it enough for B wave?

Attached Image (click to enlarge)
Click to Enlarge

Name: Screenshot2.png
Size: 102 KB
We can't control the sea, but we can learn how to surf the waves.
 
 
  • Post #312
  • Quote
  • Apr 3, 2018 4:54pm Apr 3, 2018 4:54pm
  •  Plenov
  • Joined Oct 2015 | Status: Member | 152 Posts
Shares of Amazon suddenly soared, dragging the entire stock market of the US, which was in the area of session minima.

Today, the dynamics of the company's shares, as it was in recent days, was again determined by Donald Trump. In the morning they fell in price after the hostile president's tweet ("Amazon is worth the US Postal Service of big money"), then rebounded to the opening levels of the session. After that, Donald Trump repeated the contents of his tweet at a conference in the White House, and Amazon's papers again fell to recent lows. However, around 3:45 pm, Bloomberg agency, referring to 5 anonymous sources, reported that the administration of the US president does not consider real options for pressure on the company. Neither through a court, nor through regulation.
 
 
  • Post #313
  • Quote
  • Apr 5, 2018 10:26am Apr 5, 2018 10:26am
  •  ForExtraPips
  • Joined Sep 2011 | Status: Minor crosses. Major pips. | 3,697 Posts
Just showing a view of the S&P 500 daily chart based off the square root of the swing high on 01-26-18. After finding the square root of the high, then I subtracted in increments of .5 then squared it. Noticing price is under the 360 degree line, acting as resistance. I pulled out a few weeks ago, before the drop. I wasn't about to lose all of my gains from last year. I'm short term bearish but long term bullish. Waiting for a bottom to buy again.


https://www.tradingview.com/x/c9FcvE2b/
Time turns trend. - W.D. Gann
 
 
  • Post #314
  • Quote
  • Apr 6, 2018 3:05am Apr 6, 2018 3:05am
  •  aariapoor
  • Joined Jun 2016 | Status: Forexian | 316 Posts
Quoting aariapoor
Disliked
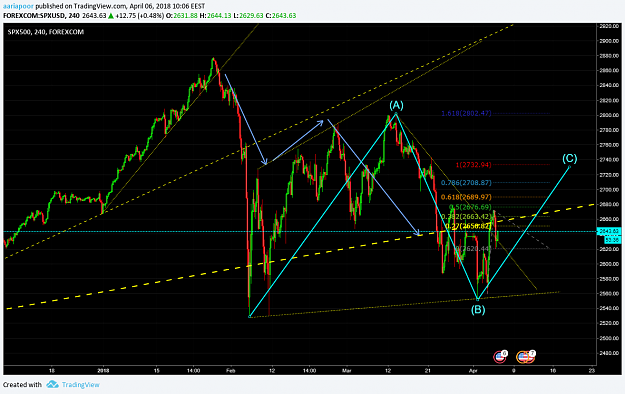
Was it rushing to finish the B wave? {image} Is it enough for B wave? {image}
Ignored
Attached Image (click to enlarge)
Click to Enlarge

Name: SnP500.PNG
Size: 115 KB
We can't control the sea, but we can learn how to surf the waves.
 
 
  • Post #315
  • Quote
  • Apr 16, 2018 10:32am Apr 16, 2018 10:32am
  •  aariapoor
  • Joined Jun 2016 | Status: Forexian | 316 Posts
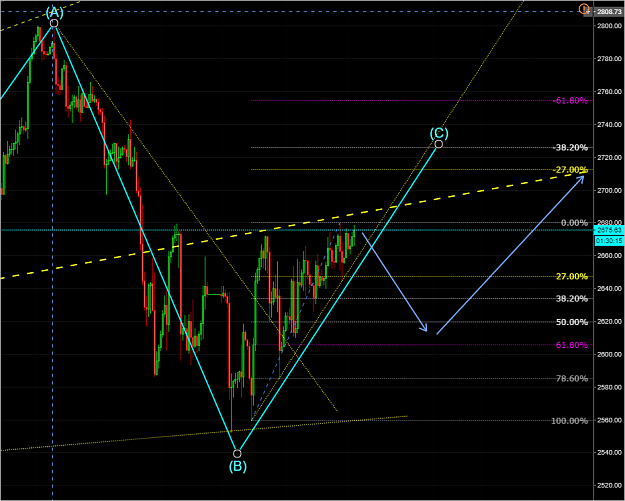
So far so good, I'm selling the possible pull back and still keeping the buy from 2570

Attached Image (click to enlarge)
Click to Enlarge

Name: Screenshot1.png
Size: 103 KB
We can't control the sea, but we can learn how to surf the waves.
 
 
  • Post #316
  • Quote
  • May 9, 2018 9:30am May 9, 2018 9:30am
  •  sqtraderTR
  • | Joined May 2018 | Status: Junior Member | 2 Posts
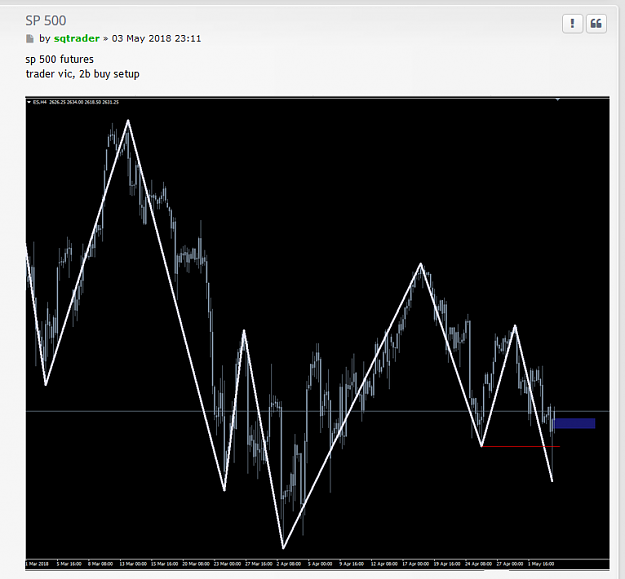
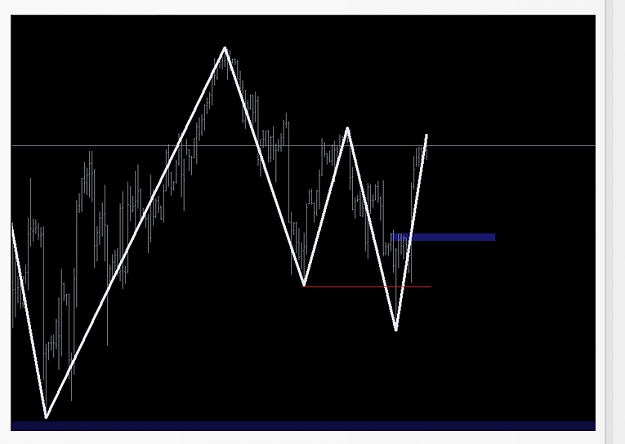
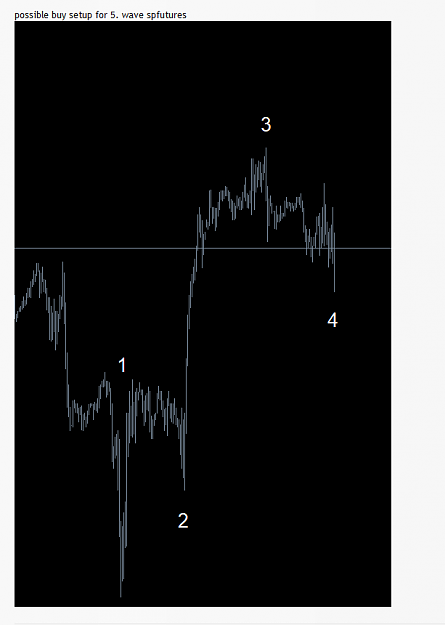
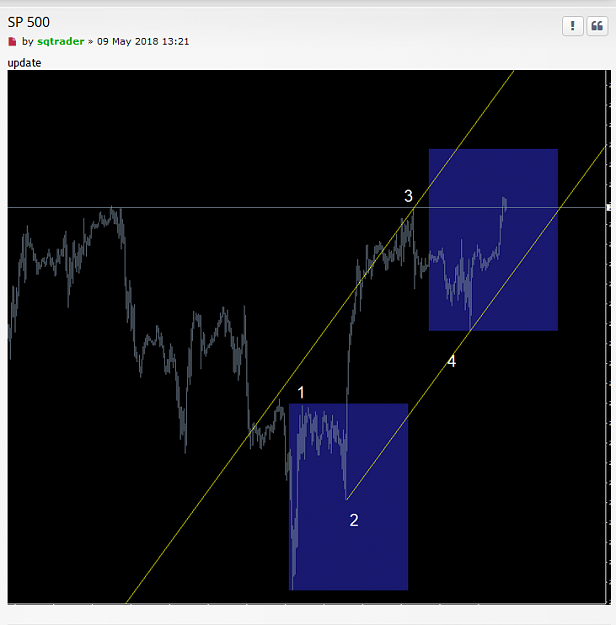
I would like to share my charts which is shared as realtime at different platforms

tradervic 2B buy setup and elliott wave buy setup


Good luck
Attached Image(s) (click to enlarge)
Click to Enlarge

Name: 1.PNG
Size: 114 KB
Click to Enlarge

Name: 2.PNG
Size: 118 KB
Click to Enlarge

Name: 3.PNG
Size: 17 KB
Click to Enlarge

Name: 4.PNG
Size: 76 KB
 
1
  • Post #317
  • Quote
  • May 9, 2018 10:16pm May 9, 2018 10:16pm
  •  ForExtraPips
  • Joined Sep 2011 | Status: Minor crosses. Major pips. | 3,697 Posts
I took the top two candles on the two swing highs and connected a trend line to both of them on a yearly chart. And where they intersect at is making me more bearish long term. Where price meets time type thing.

https://www.tradingview.com/x/qwu4keEk/
Time turns trend. - W.D. Gann
 
 
  • Post #318
  • Quote
  • May 13, 2018 8:10pm May 13, 2018 8:10pm
  •  sqtraderTR
  • | Joined May 2018 | Status: Junior Member | 2 Posts
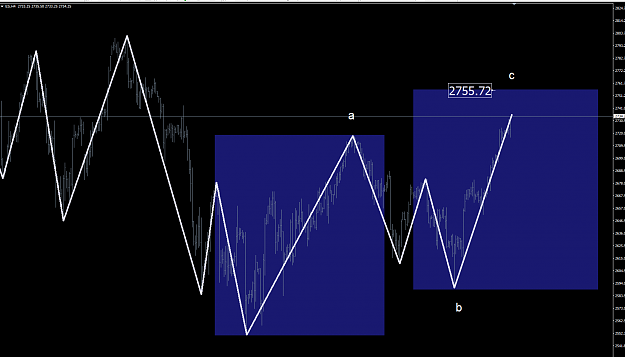
Elliot wave ABC pattern setup for possible drop, Important level is 2755,xxx

Good luck
Attached Image (click to enlarge)
Click to Enlarge

Name: so.PNG
Size: 71 KB
 
1
  • Post #319
  • Quote
  • May 15, 2018 1:21pm May 15, 2018 1:21pm
  •  TraderInput
  • | Commercial Member | Joined May 2018 | 24 Posts
S&P 500 Futures: #ES Sells Off But Eeks Out a Small Gain
Who needs legal gambling when you have the S&P 500 futures? After the major markets fell 10%, the S&P, Dow and Nasdaq have come flying back up. No one can deny the big rally, but the big question is, where has all the volume gone? With the 8 day rally continuing, and the May options expiration this week, one has to wonder of its time for a pullback. Every trader we talk to keeps saying the ES will fill the 2752.00 gap, but we are not sure that’s in the cards this week. The ES has rallied 150 handles in 8 days, and is overbought and over extended short term.
 
 
  • Post #320
  • Quote
  • Jun 29, 2018 11:43pm Jun 29, 2018 11:43pm
  •  skyhok
  • Joined Feb 2014 | Status: Member | 1,794 Posts
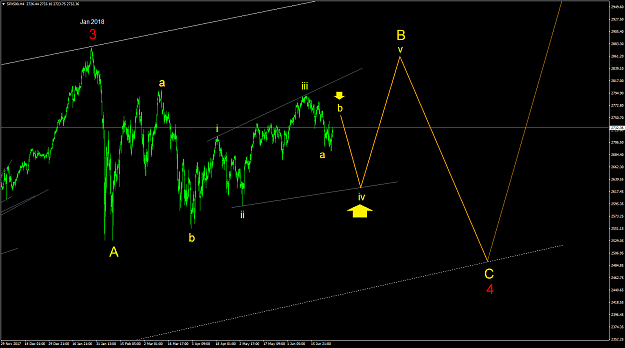
S&P500 H4
Tracking its consolidation since January 2018 top.
Attached Image (click to enlarge)
Click to Enlarge

Name: SPX500H4 30Jun18.png
Size: 51 KB
Elliott Wave for optimum entry, exit and risk management of trades
 
1
  • Interactive Trading
  • /
  • S&P500 trading
  • Reply to Thread
    • 1 1415Page 161718 48
    • 1 15Page 1617 48
0 traders viewing now
  • More
Top of Page
  • Facebook
  • Twitter
About FF
  • Mission
  • Products
  • User Guide
  • Media Kit
  • Blog
  • Contact
FF Products
  • Forums
  • Trades
  • Calendar
  • News
  • Market
  • Brokers
  • Trade Explorer
FF Website
  • Homepage
  • Search
  • Members
  • Report a Bug
Follow FF
  • Facebook
  • Twitter

FF Sister Sites:

  • Metals Mine
  • Energy EXCH
  • Crypto Craft

Forex Factory® is a brand of Fair Economy, Inc.

Terms of Service / ©2023