Hi, Donato! Why do you use tick chart for futures trading?
Ignored
Hello Alkor. I use constant tick and constant volume charts because they minimize the impact of "time" on the chart and thus give a clearer view of the order flow. I have tried viewing just the order flow on the futures market but during times of rapid price movement it is too complicated for me to understand. Price bars (using constant tick/volume) leave only the element of order flow out, thus I can see more clearly where the order flow is waxing and waning regardless with whether or not a 5 min or 1 min bar has finished forming. I hope this makes sense
Attached Image (click to enlarge)
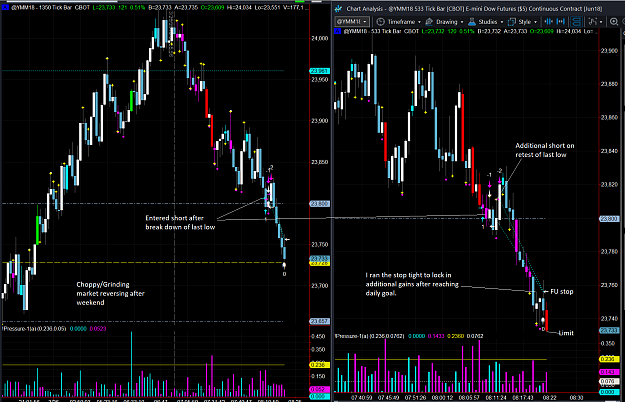
This chart shows what I call a "FU stop" Where I got stopped out just before reaching my limit...I HATE it when this happens, but still made the weekly goal on this one trade
Definetly on the right path. At lower timeframes intraday add OBV or cumulative deltas for “quality” of volume. Will help determine market makers accumulation (exhaustion, absorption). Also volume profile? Have you studied? agree about wave theory and any price indicator. Rubbish the instos want you to be using. Helps them accumulate your liquidity. Do you intraday trade?
Ignored
Hello MLeslie...Yes I do intraday trade but not on the Foreign Exchange Market. For reasons I expressed early in this thread. Many due to the dubious nature of intraday tick volume. I trade e-minis on the futures market. (See above post for an example of my charts). Welcome, I hope you find something of value here.
This chart shows what I call a "FU stop" Where I got stopped out just before reaching my limit...I HATE it when this happens, but still made the weekly goal on this one trade
Ignored
DonPato, thank you!
You did not use the following structure to enteres: Climax, Exhaustion, Absorption?
{quote} DonPato, thank you! You did not use the following structure to enteres: Climax, Exhaustion, Absorption?
Ignored
Yes I did use these phases...but I don't always trade reversals...sometimes I trade continuations. When I opened my trading platform, I saw that a long signal - based on selling exhaustion - had failed...twice. I saw no reason to fight such a "one way" order flow so I joined in the direction of the order flow
Attached Image (click to enlarge)
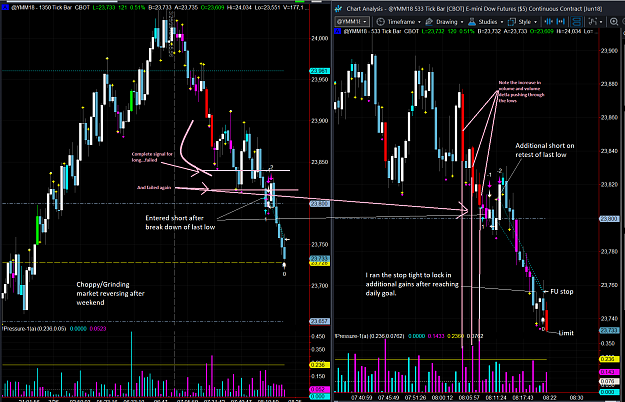
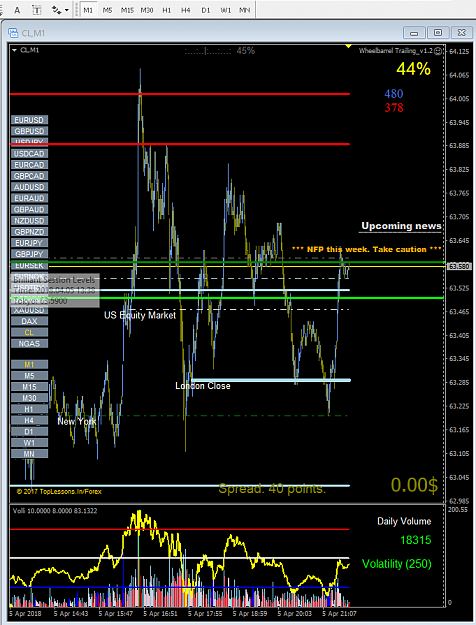
I have annotated (in pink) the failed signal and saw that price continued to punch through the lows. Why fight that? Just jump in...hold on...and keep your stop out of the way...that last bit I didn't quite manage as well as I should have. I got so excited to see a week's profit in just one trade I wanted to keep it...so I tightened my stop and "bah-da-bing" got the F*** You stop (FU stop). But I still made my week so I was OK...even though I hate it when this happens.
Here is a screen shot from yesterday's trading...I didn't trade today... where I did use the reversal signal.
Attached Image (click to enlarge)
This trade also ended up with a week's profit in just a few minutes...so I decided to take the day off and NOT risk what I had just made. In premarket I opened the platform and saw a completed buying exhaustion signal. About 10 min before the open I was filled with all my orders. As soon as the market opened price "chopped" its way down to my limit. I didn't know it at the time, but that ended up being the low of the session.
Emini? Very nice!!! So you must be doing very well. Can i ask what kind of gains on average per week would you make 2:1, 4:1, 10:1, higher? This is definetly trading excellent work. Are you watching vix and usd futures at entry/exits? Or something else?
Emini? Very nice!!! So you must be doing very well. Can i ask what kind of gains on average per week would you make 2:1, 4:1, 10:1, higher? This is definetly trading excellent work. Are you watching vix and usd futures at entry/exits? Or something else?
Ignored
Thank you for your kind remarks...The average trade for me is a risk-to-reward ratio of 2.8:1 I usually just take profit at that level and tend NOT to ride trends although lately they have paid off in spades, but that is more the exception to the rule and the market has been extremely volatile for the past month. Thus if that volatility makes me a week in just one trade I tend NOT to put it at risk again until the next week. I came up with this level after many years of data collection on my trading and the way I run my stops...I found that even though SOME trades did go farther, as evidenced lately, most often the most efficient way to trade is just take profit at the "sweet spot"...and for me that is 2.8:1.
I trade using order flow and market structure concepts. The point of this thread was to translate those lessons to the FX market but it has proven a challenge. I have said this ad nauseum here on this thread. Tick volume is very different from the actual volume in the futures market...and that's what makes a HUGE difference if day trading on the FX. However, using the entire day's tick volume data one can extrapolate a fairly close volume delta that can then be used to make reasonable trade entries and exits on longer time frames...(nothing less than daily charts).
This is because the tick volume data on intraday time frames waxes and wanes between sessions, (Tokoyo, London, NY), thus in a low volume environment between sessions (or gap time), many false or erroneous signals can be generated, not because the order flow isn't there, but because the true measure of its strength or weakness is not reflected in tick data. That being said, using the entire day's data that transcends the gap times, one can make some reasonably rational decisions based on extrapolation of delta.
{quote} Thank you for your kind remarks...The average trade for me is a risk-to-reward ratio of 2.8:1 I usually just take profit at that level and tend NOT to ride trends although lately they have paid off in spades, but that is more the exception to the rule and the market has been extremely volatile for the past month. Thus if that volatility makes me a week in just one trade I tend NOT to put it at risk again until the next week. I came up with this level after many years of data collection on my trading and the way I run my stops...I found...
Ignored
Lol all good. Well done mate!
unless youre trading nekkei i wouldnt even use asia liquidity in your calculations. Why not use futures volume for spot market?
Lol all good. Well done mate! unless youre trading nekkei i wouldnt even use asia liquidity in your calculations. Why not use futures volume for spot market?
Ignored
Been there...tried that. I ended up with my head moving back and forth to try and translate volume on one screen with price on the other that I swear my head turned 360°. I figured I needed to find a better way.
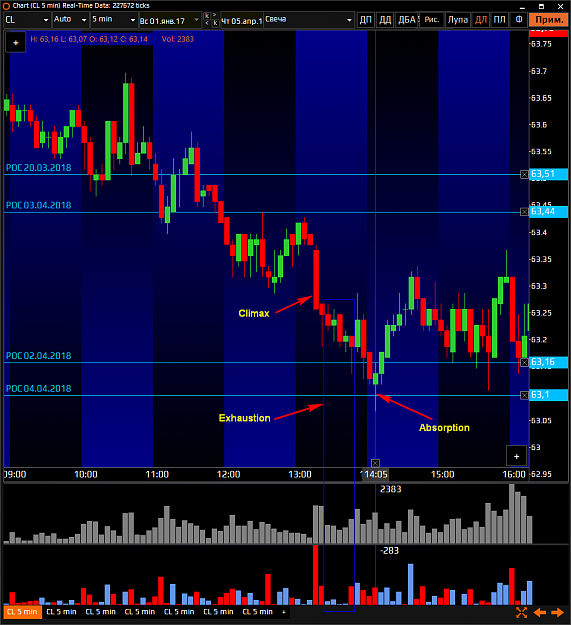
I'd say you have this concept well in hand. You have pointed out the very same anomalies that I look for when I trade. Lets take them one at a time:
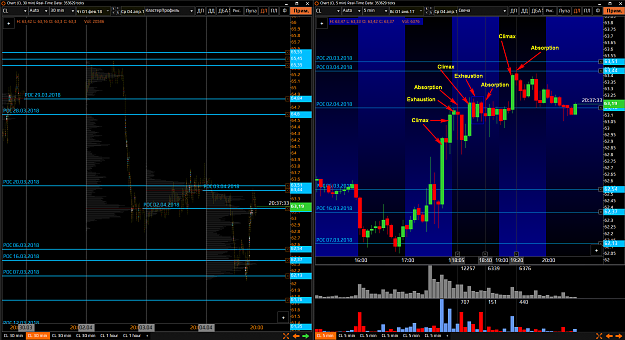
Climax: Fairly obvious the one you have pointed out. I think you will notice that these bars almost always form when price breaks through to a new high or low. The big "tell" is when a trend is formed and there is NO new support level being broken, but volume climaxes down (or up as the case may be) and looks like an acceleration. I don't see it here on your chart but I'm sure it occurs...
Exhaustion: Well done!! You can see a series of bars there that show (what I assume is delta at the bottom of your chart) bullish - however weak - but bullish and several of those bars finish strongly bearish. This is the anomaly that I look for in exhaustion. This is a sign that selling is waning and also that buying interest is starting to come in...my guess would be that this area is where sellers are taking profit and selling to the late (usually retail) trader.
Absorption: NAIL ON THE HEAD!! (1) Rising volume (2) Rising Bearish Delta (3) bar finished significantly off the lows and in this case was a bullish finish. For those that read only volume this "should have been" a bearish finish but it wasn't...why is that? Think about this...MORE SELLING THAN BUYING, yet bar finished well off the lows - even bullish.
Answer: somewhere in the lower wick of that bar all that selling met up with a large group of pending orders and was absorbed. Once the all those selling orders where satisfied, all that was left was for the remaining buy orders to be filled, thus price started moving higher, and in fact the candle finished bullish.
Often times this area is retested again, and I see it was and produced yet another absorption bar (7th from the right). This bar had the opposite profile but still shows the same absorption in approximately the same area. Rising bullish delta but a bearish close that is well off the lows. You often don't get a "confirmation" bar but if ever there was one this one is it.
DonPato, thanks for the comment! Have you tried using the Delta chart constant to estimate the order flow?
Ignored
I've not heard of that chart config. I will check it out. To my knowledge my provider (TradeStation) does not offer that...but I will check. I do use constant volume and constant tick...bu b not heard of delta charts.
Hey DonPato thanks for the detailed and analytical response. It's taken me awhile to get back due to other obligations...I need to carve out time every day until I get a better handle on some of these concepts. In your earlier post(usd/cad) you took a position based on market flow. The buyers had pushed through an area of selling and established a new level of support however, you never mentioned volume or the phases mentioned in this thread(climax, exhaustion and absorption). Do you look at a chart and take a position based on these candle moves(areas of balance) or do you always look for confirmation in volume, tick data etc?
I tend to agree on Elliott wave I'm trying to apply it but it's hard to make the correct assessment of where you are in the wave hierarchy. I know some people do it successfully but perhaps for me it's just another tool to help make informed decisions regarding which way price will move.
...In your earlier post(usd/cad) you took a position based on market flow. The buyers had pushed through an area of selling and established a new level of support however, you never mentioned volume or the phases mentioned in this thread(climax, exhaustion and absorption). Do you look at a chart and take a position based on these candle moves(areas of balance) or do you always look for confirmation in volume, tick data etc?....
Ignored
If I recall correctly on that particular trade I was exploring different volume providers to see if I could find or code something that would create a similar experience to the delta indicator I was using in the futures market. (I had not yet coded the "extrapolated delta" indicator I now use).
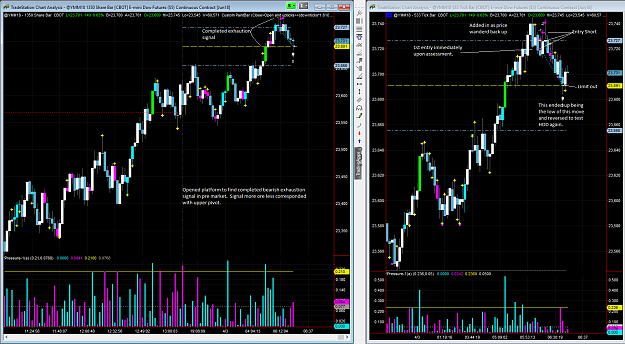
So to answer your question I used a little of both of what you mentioned...I had to look back at the posts to find this screen shot.
Attached Image (click to enlarge)
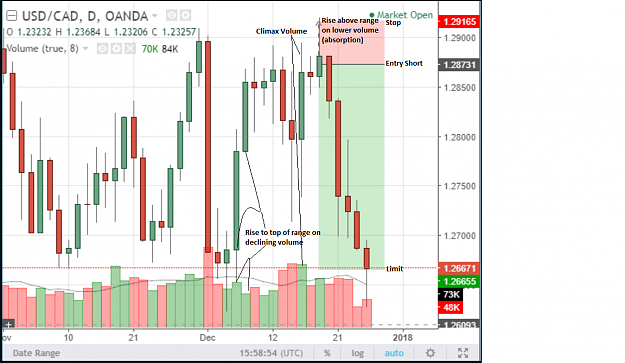
USD/CAD has been in a 200+ pip range for several weeks. As is typical of ranges the majority of the volume is in the middle of the range and then volume tapers off a the edges...this is how I define a "stable" range. I anotated here the climax volume that pushed price up to the top of the range but couldn't push price through the resistance at the top. Then price stalled there and did finally push though the top of the range but could NOT close above it...it did this on declining bullish volume. So I interpreted these candles as "climax" and "absorption" phases...
As this corresponded exactly at the top of the range it only added to the validity that this top was holding and I was "clear" to short after seeing specifically the buying absorption at the top. I hope this makes more sense...
OK...I will try this again, and hope it works this time... {quote} I too studied Elliott Wave theory. I eventually found it frustrating and confusing. I'm sure it worked for Ralph Nelson Elliot, but I have been unable to make it work for me. I found it is unnecessarily too complicated and places a level of interference between the practitioner (technician) and the actual market. I think you (or anyone) would be much better served devoting your learning to the basics of how the market actually functions. What I call the fundamental "structure" of...
Hey DonPato I think we got our posts confused. Here is the post I was referring to. I think you went back to an earlier post from 2017 but this is the one from April 9th of this year.
Hey DonPato I think we got our posts confused. Here is the post I was referring to. I think you went back to an earlier post from 2017 but this is the one from April 9th of this year.
Ignored
Ok now I'm confused... what question did you have that was NOT answer in the quoted post? I believe I was very specific.
I was asking whether you had taken that position based on market flow alone or whether you had also incorporated aspects of volume, tick data or climax, exhaustion and absorption as confirming indicators.
I was asking whether you had taken that position based on market flow alone or whether you had also incorporated aspects of volume, tick data or climax, exhaustion and absorption as confirming indicators.
Ignored
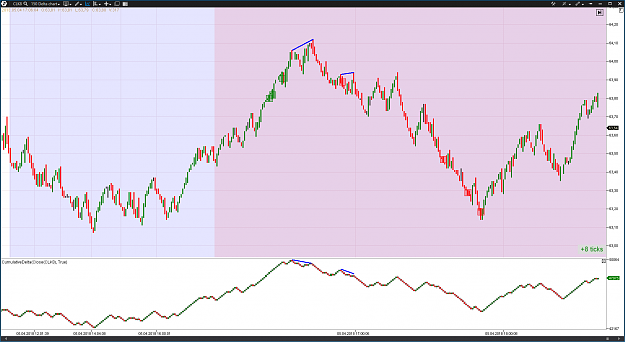
Hello again Sully...yes all of the above. Again, I look for exhaustion when I am wanting to trade reversals (even if they are back in the direction of the overall trend). The screen shot posted showed a bit red bearish candle which indicates climax. This is also confirmed by the "extrapolated Delta" indicator at the bottom of the chart. The very next candle formed (what many here would call a "pin bar"), and showed bullish volume that indicated the climax selling had been short lived. In addition this same candle formed on rising tick volume (seen at the bottom of the price chart.
All of this occurred in an area where I would expect buyers to step in as it was a retest of a previous range high, (best seen on the weekly chart). So YES, I used market flow, I used volume (tick volume is all we have here in FX), the phases I spoke about in the beginning of the thread...all of that...
The order flow did change and price went sideways, but then collapsed down further...and this trade was a loser...we can't win them all. That is why we call this business "speculation".