I backtested the EURUSD in August and also found it to be a tough month to trade in. However I have not done the earlier months in the year that might have been really great for this system.
I'm doing the same thing that you're doing with your demo. I'm trading as many setups as I can to see which ones perform the best.
So far, it appears that the GBPUSD is giving me the most consistent positive results. The EURUSD has been a little flaky lately, so I can't really report on it. I will be staying away from the NZDUSD, AUDUSD, and USDCAD. They seem to consistently bomb out.
One thing I have learned by doing this is never take a trade on the EURUSD and GBPUSD in opposite directions, even if the setup says so. I do realize that they most often follow each other, but there have been some Mouteki setups that suggested that I take opposite positions. But I won't.
Also the EURJPY and the EURGBP seem to work quite well with Mr. Mouteki's method.
Hope this helps somebody.
By the way, thanks again Mr. Mouteki for your generousity. For the first time in my almopst year of trading the Forex, I am a winner!
Regards,
Bill
PS: Jumper, just for the heck of it, I turned on HA candles to see if they would give me a confirming view. Try it, very interesting.
|
Joined Apr 2006
|
Status: Constantly learning
|150 Posts
Why is the stoploss a specific amount? Is it not better to have a stoploss placed under/over a strong resistance line, and adjust the units to fit your money management?
Thanks again for your gracious assistance.. My humble apologies for the chart.. First time doing a chart and posting on forum.. For some reason I can never get it to look right even when I change the size...
We are undoubtedly using different platforms which I believe to be the problem.. If you review the chart I first submitted you will see the candle which I have chosen has the longer wick going downward .. Thats why I choose the point of 2663
Looking at yours there seems to be a discrepancy between price and time.
Thanks,
Sanchez
Quoting jumper
Disliked
Hello Sanchez, your supply line is drawn correctly -- but I am assuming that the next bar doesn't invalidate the resistance at point #1. Otherwise, that supply line would not be valid. Remember you need 2 bars on the right that is lower -- if the most recent bar shoots up, point #1 of supply line would not be a resistance anymore... so just take note here.
However, you have chosen the wrong point for the lowest low -- see my beige vertical line below. Look for the lowest low not in consolidation. I have also shown the projected profit PP for you.
PS.: Try to make your charts bigger in future.. may be easier to look at?
|
Joined Sep 2006
|
Status: Don't think. Just jump.
|534 Posts
My apologies then. I drew the lines using your chart. I downloaded your chart, enlarged it and drew the lines. Your vertical line is obstructing your chosen candle and I couldn't see where the low is. It just slipped my mind that this low might indeed be lower than the one I chose.
So as long as you know what you are doing... then all's good!
I am not sure if you had subtracted the low from the right level though - since I couldn't see a line there. You may not have drawn it.. that's fine of course, but just to be sure, I drew it below for you to check.
PS.: It is true that different charts may generate different patterns. :/
Does anyone like this currency the best out of all the others? Is this particular trend we are currently in especially special or is the cable usually this good. I am only demoing but within the last few days, there have been 3 clear cut short signals and they keep hitting the price target.
Why is the stoploss a specific amount? Is it not better to have a stoploss placed under/over a strong resistance line, and adjust the units to fit your money management?
Ignored
yea! that's what I'm doing cause I'm too lazy to figure out the math
The highest high (for a supply line ofcourse) can be any point between A and B, inclusive of the candles making up points A and B.
As far as the EURUSD, I don't think its suited to the Mouteki method because it is daytraded much more than any other pair, and that, in my mind, detracts from its 'trendability.'
Just my 2.
Quoting ra300z
Disliked
Shouldn't the highest high be between point A and point B?
Would that be inclusive? For example, if your point A also had the highest high, would you use that candle or some other candle between A and B not including the points A and B where the demand line is drawn?
Also, in terms of EURUSD in the late July or early August timeframe, I think there could be dozens of false signals given. Anyone to prove me wrong?
Good afternoon everyone! I have searched all over the forums for documentation with regards to the Demark Trend indicator. Does anyone have it or know where it is? Thanks for you help!
I backtested the EURUSD in August and also found it to be a tough month to trade in. However I have not done the earlier months in the year that might have been really great for this system.
Ignored
Hey all. I was curious as to how bad august was so I manually backtested it.
According to my backtesting I was up 284 pips for the month of August!
(If that was a bad month, I'd love to see a good month) A list of taken trades are shown at the end of this posting.
For my backtesting, I followed mouteki's rules to the T and i tested from august 1 through august 31.
A couple of things to point out however during that month:
1) When two adjacent candles (in a five candle that determines support\resistance) had the exact same highs for a resistance point or the exact same lows for a support point, i took the more recent high to be the support or resistance point.
2)Stop losses were moved up to 10 pip profit point when the price action moved more than 40 pips in the projected direction. (this is in accordance with mouteki's stop loss rules)
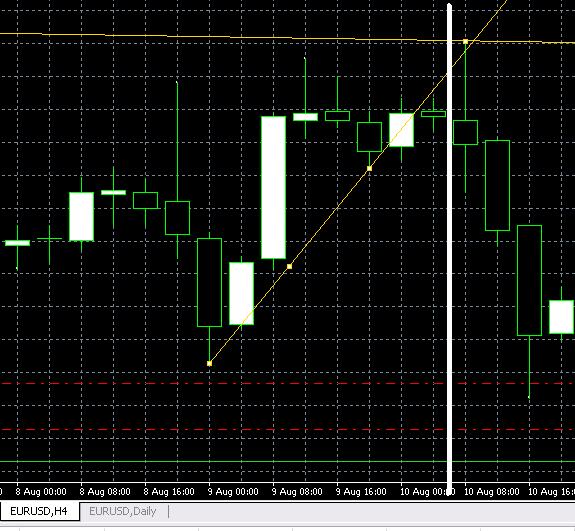
3) support point or resistance points must be verified with two lower highs or higher lows respectively on each side of the sup\res point. however in some cases the candles that contain the higher lows or lower highs open in such a way it's already broken the trendline. Please reference the picture below. one can see to the left of the fat white line how the fifth candle needed to verify a valid resistance candle has opened below the trendline).
in this case i used the open of that candle as the reference from which to subtract my price projection. This is considered by mouteki to be a valid resistance point. Reference the mouteki trading thread (post#19)
In this case the open and close are near one another it doesn't really matter to much whether i considered my position open on the open or close of the candle in question or whether i open my position on the) open of the next candle. I would recommend opening on a position on close of the candle in question when this happens (and it's close to the trendline break and there's significant room in the price projection).
4) position were immediately closed and reversed if an opposing trendline was broken. e.g. if i had buy on after the break of a supply trendline and while that trade was on, a candle broke the demand trendline, i would then close the buy order and open the sell order.
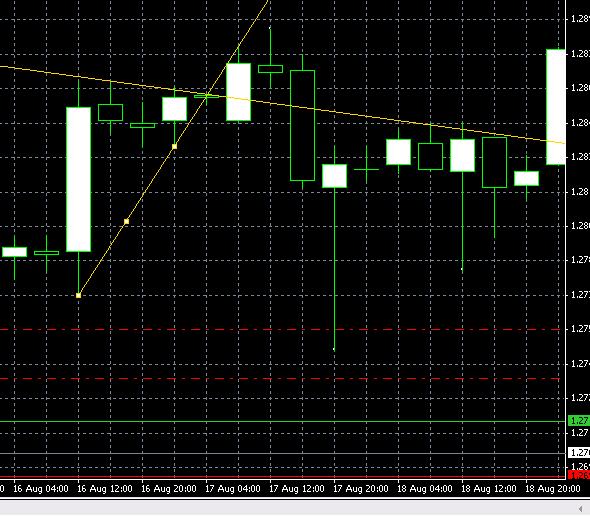
5) in one instance the higher low\lower high candle opened in such a way that it broke both the support and demand line. in this case, the trade was not taken. please reference the second attached picture for what i am talking about.
Trade journal
Trade #1 = 10 pips (stop loss hit)
Trade #2= 10 pips (stop loss hit)
Trade #3= 85 pips
Trade #4= 3 pips (reversed positions due to opposing trendline break)
Trade #5= 54 pips
Trade #6= 10 pips
Trade #7 = not taken (broke both trendlines simultaneously)
Trade #8= 38 pips
Trade #9 = 90 pips
Trade #10=-35 pips loss
Trade #11 =45 pips
Trade #12=18 pips
Trade #13=-17 pips (reversed positions due to opposing trendline break)
Trade #14=10 pips
Trade #15= -37 pips
Total Number of Wins =12
Total Number of Losses=3
Total Profits=284
Thanks again. yup got it figured out.. One more question if you please. The trend line and supply line is adjusted as price changes.. I have noted that the first point changes however the second point remains the same?
Thanks
Sanchez
Quoting jumper
Disliked
My apologies then. I drew the lines using your chart. I downloaded your chart, enlarged it and drew the lines. Your vertical line is obstructing your chosen candle and I couldn't see where the low is. It just slipped my mind that this low might indeed be lower than the one I chose.
So as long as you know what you are doing... then all's good!
I am not sure if you had subtracted the low from the right level though - since I couldn't see a line there. You may not have drawn it.. that's fine of course, but just to be sure, I drew it below for you to check.
PS.: It is true that different charts may generate different patterns. :/
The highest high (for a supply line ofcourse) can be any point between A and B, inclusive of the candles making up points A and B.
As far as the EURUSD, I don't think its suited to the Mouteki method because it is daytraded much more than any other pair, and that, in my mind, detracts from its 'trendability.'
Just my 2.
Ignored
I think the highest high more recent than the last support point is valid.
typically the projection occurs within points A and B (from what I've seen), but if one occurs more recent than point A--with point A being the most recent support or resistant--taking that high seems to fall within mouteki's trading framework even if it falls outside of points A and B. The most recent price action has the most value in terms of information according to mouteki and that should take precedence.
It totally would not make sense to take older highs in outside points A and B, otherwise which high would you use? one could go back 20 years for that, whereas going forward in time, we are constrained by the most recent candle.
regards,
phoenix
p.s. perhaps someone should post horace kent's question on the mouteki question thread. *hint* *hint* ..horace?