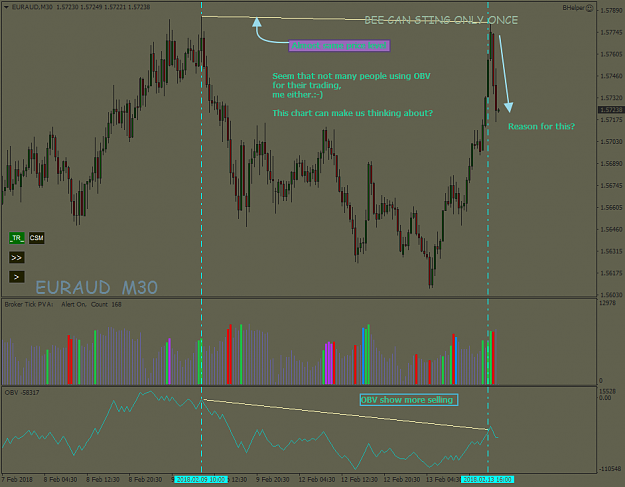
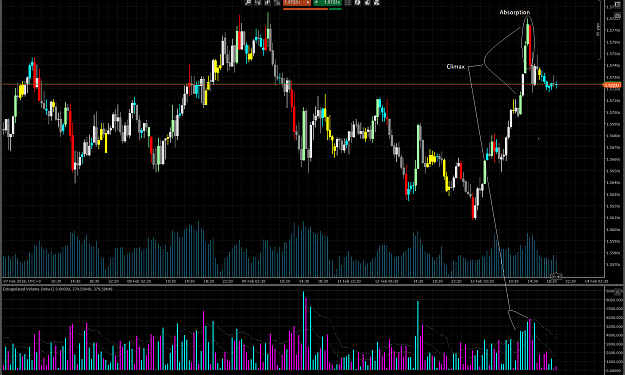
Disliked{quote} Hi Don, I noticed a couple of times a "volume pattern" which happen sometimes: an absorbtion which happens in two candles not in one candle. An example is in the chartshot you posted - first pivot signaled by you - where the pivot candle is at a very low volume, and the next one has an increased volume. These two candles can give an image of sellers absorbtion - if i make a single candle from these two, the result is kind of pinbar, and the volume is rising toward the end of pinbar. Do you use also patterns of multiple candles like this...Ignored
Attached Image (click to enlarge)
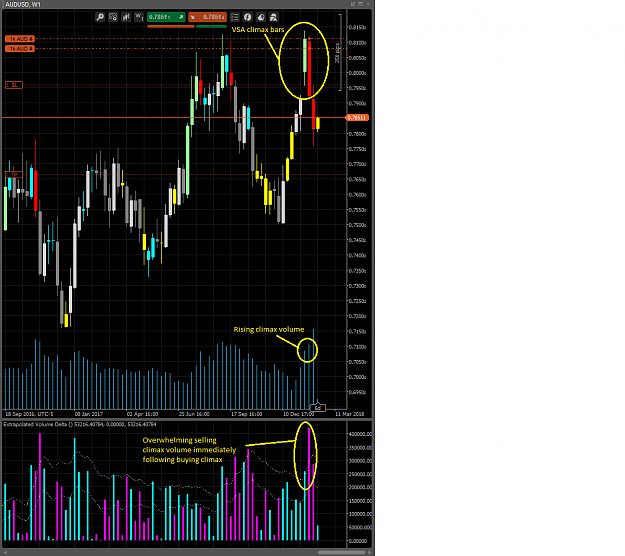
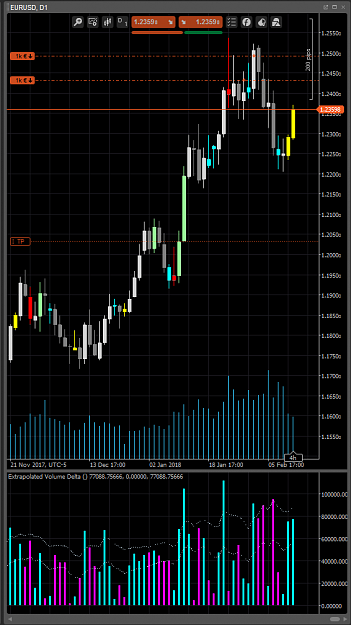
It is where climax volume is overwhelmed by even higher opposing climax volume. This example is especially good because it is a "three way signal". Not only did VSA analysis tag it as climax volume, but also, just plain tick volume showed the huge rise in volume (again at a significant level) but as well, volume delta showed buying climax immediately followed by even higher and obviously overwhelming selling climax volume.
Therefore yes, I use those as absorption indications...where the competing climax shows even more tick volume. I hope this is clear.
@xxxx§|[::::::::::::::::>