Conventional trading is for losers

- #84
- Jan 29, 2018 6:39am Jan 29, 2018 6:39am
- Joined Dec 2015 | Status: Trader | 8,774 Posts
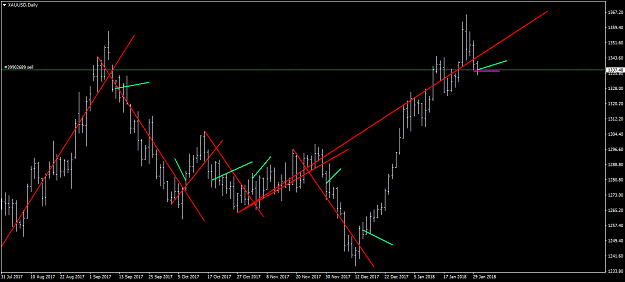
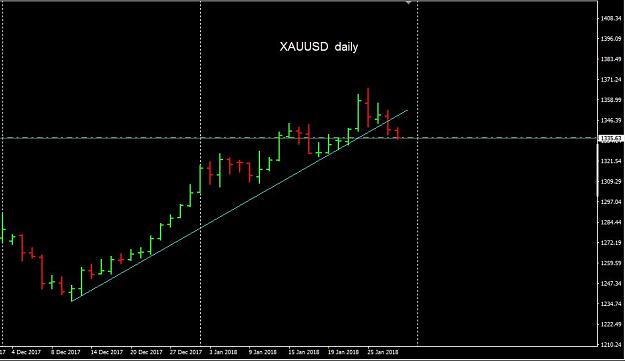
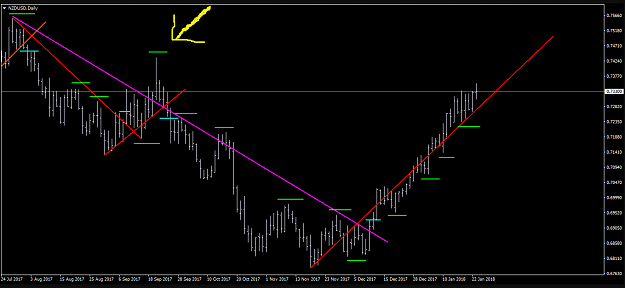
Do your homework, follow the footprints of smart money
- #89
- Jan 29, 2018 7:19pm Jan 29, 2018 7:19pm
- | Joined Apr 2008 | Status: Trader | 1,040 Posts
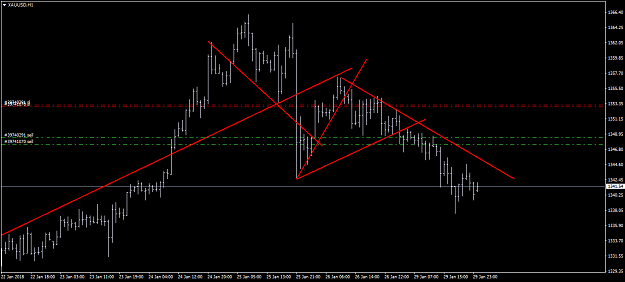
Good Trading