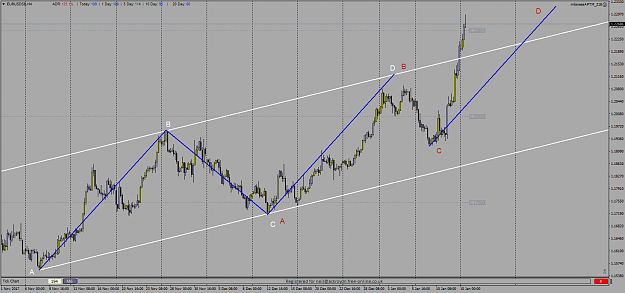
DislikedHi: Once more i want to try predicting the next week price movement of EURUSD H4 . What we can see in the picture is two AB=CD pattern, inside each other and a bullish trend channel . The smaller ab=cd ,has already reached its d point at >141.4% fib projection, and price has broken the upper trend line boundary. From here we may expect a correction: 1)Either down to the retest of trend line and then continuing upward to complete the larger AB=CD. 2)Or Going even more down, breaking the 1.2020 level, forming a NSL , which in this case , i expect...Ignored
Hi Parviz,
I have a quick question regarding where you have drawn your EURUSD larger AB leg from/to on the H4 chart. On my attached chart I have marked with white letters an AB=CD pattern which seems to have already completed. The red letters are where you have drawn your AB=CD. Have you drawn your AB leg on what I have as a CD leg because the original pattern has completed and you are just moving along to the right for the next possible AB=CD pattern or is the AB=CD I have marked in white wrong in some way? Any help with answering this is much appreciated.
Also just wanted to say I have been following this thread for a little while, watching the videos and reading the thread and as this is my first post here I wanted to say a big thank you to Damian and all others here. The information has been a huge help to me.
Many thanks
Attached Image (click to enlarge)
1