• Home
  • Forums
  • Trades
  • News
  • Calendar
  • Market
  • Brokers
  • Login
  • Join
  • User/Email: Password:
  • 6:07pm
Menu
  • Forums
  • Trades
  • News
  • Calendar
  • Market
  • Brokers
  • Login
  • Join
  • 6:07pm
Sister Sites
  • Metals Mine
  • Energy EXCH
  • Crypto Craft

Options

Bookmark Thread

First Page First Unread Last Page Last Post

Printable Version

Similar Threads

Learning to trade with harmonics 11 replies

Time for Change - Pivots & Harmonics to freedom 67 replies

180 reasons to trade Harmonics and Patterns 13 replies

Group Trading based on Elliott wave and Harmonics 0 replies

Different Pairs, Different "Character"? 2 replies

  • Trading Journals
  • /
  • Reply to Thread
  • Subscribe
  • 26
Attachments: "Ratios & Harmonics: a Different Way to Trade." Summary
Exit Attachments

"Ratios & Harmonics: a Different Way to Trade." Summary

  • Last Post
  •  
  • Page 1 2
  • Page 1 2
  •  
  • Post #1
  • Quote
  • First Post: Edited Mar 29, 2013 11:43am Jan 3, 2013 8:25pm | Edited Mar 29, 2013 11:43am
  •  Kilian19
  • Joined Jan 2011 | Status: Currently in Asia | 839 Posts
I am stunned by the time successful traders offer to help the community. Recently I discovered Mr. Pips system "Ratios & Harmonics: a Diferent Way to Trade". This system is a real gem and unlike many of the other systems it is proven to work. It is a complete system and not a work in progress even though everything can be developed and improved over time.

Mr Pips is so kind to offer his help for us to understand his systems and many questions gets asked.

There is one big problems that every good thread faces. They get flooded with ridiculous amounts of posts and just after 9 days there are already over 550 of them. New people will have a hard time to work through all this and I would like to have 1 place where all the important information are collected.
I will create a new thread here just containing Mr Pips posts.
Update: Right now I will just mirror his posts 1:1 but I am also want to create a pdf with all important information
I will not mirror the thread 1 to 1 anymore since there are still way to many posts by mister pip. If you want to read them all head back to the original thread
.This is located at the trading journal section because I don't want anyone to get distract by having 2 threads at the trading system forum.

1. Mr pip suggests the book Harmonic Trader by Scott Carney. You can find this ebook here: http://ebookbrowse.com/harmonic-trad...pdf-d417150144
2. This strategy can be traded on any timeframe. Tick charts are also recommended: http://articles.mql4.com/548


Ed777 suggested a list of all videos by Mr Pip:
#1: Fibonacci Retracement http://youtube.com/watch?feature=pla...&v=6SvcmyIkmtM
#2: USDCHF Bat youtube.com/watch?v=ULCYNlq4YyA
#3: EURUSD Harmonics 15Min http://youtube.com/watch?feature=pla...&v=fP8jQw6ZGjI
#4: AUDUSD Agressive C 1-3 http://youtube.com/watch?feature=pla...&v=aMupwIOLRgk
#5: ABCD vs AB=CD http://youtube.com/watch?feature=pla...&v=GrCdDmkJMuY
#6: Swing ID http://youtube.com/watch?feature=pla...&v=319oUEQTm_Y
#7: Trade Session 1-14
Inserted Video


You can also visit his youtube channel youtube.com/user/DCASTFX/videos

Please don't post here. You should head over to the original thread and say thanks to Mr Pip.

(http://www.forexfactory.com/mr.*pip)
http://www.forexfactory.com/showthread.php?t=402253
  • Post #2
  • Quote
  • Jan 3, 2013 8:26pm Jan 3, 2013 8:26pm
  •  Kilian19
  • Joined Jan 2011 | Status: Currently in Asia | 839 Posts

Disclaimer: "This is just a collection of Mr. Pips (http://www.forexfactory.com/showthread.php?p=6322687) thread. Please do not post here!


Post# 1 First Post: Dec 26, 2012 6:43pm | Edited Dec 26, 2012 11:05pm

I’m Mr. Pip; I am a fulltime trader and trade ratios and harmonics. I’m starting this thread with the purpose of providing some insight on the topic of ratios and harmonic trading.


I understand this is an advance method of trading but let’s not let that affect our ability to learn from this style of trading. I will not be providing you with any resume as to how long I’ve been trading nor will I be answering questions about my results, how many pips I make per week and all the other questions that follow suit. Let’s understand that my result will not be equal to yours and therefore are irrelevant to the purpose to this thread.


Results have more to do with the trader then the system traded. You will either see value or you won’t. If you do great stick aroundand we can learn from each other. This is a never ending journey and learning should always be #1 on your priority list.


This system is based on price action, ratios and harmonics. NO indictors will be added or used. Please do not post any as they are not part of this system. All traders and their ideas deserve the upmost respect and that is the only rule for now.


As I mentioned I am a full time trader and my focus will be to my trading first. I will after my trading is finished for the day come here to post and answer questions. Please let me know if there is an interest in harmonics and ratios so I can continue on our journey.


I welcome and call out all harmonics and ratio traders to participate and post. I wish everyone the very best in all your endeavors.


Best Regards,

Mr. Pip
1
  • Post #3
  • Quote
  • Jan 3, 2013 8:27pm Jan 3, 2013 8:27pm
  •  Kilian19
  • Joined Jan 2011 | Status: Currently in Asia | 839 Posts

Disclaimer: "This is just a collection of Mr. Pips (http://www.forexfactory.com/showthread.php?p=6322687) thread. Please do not post here!


http://www.forexfactory.com/showthre...87#post6322687

Post# 2 Dec 26, 2012 6:57pm

What is market harmonics? Is it possible that the marketsare not random? The answer is yes there is nothing random about this or any other market or instrument you wish to trade.

Harmonics is the process of identifying the market’s rhythm or its pulse if you will and exploiting any and all opportunities. There are visual occurrences that have tendencies to repeat themselves over and over again. It is our job as chart technicians to identify them and trade them. The principles of harmonics and ratios have no boundaries. They can be applied to any instrument or timeframe. We will peel away the myth of the term “noise” and learn to focus on the only thing that matters on a chart, PRICE.

Regard,

Mr. Pip
1
  • Post #4
  • Quote
  • Jan 3, 2013 8:32pm Jan 3, 2013 8:32pm
  •  Kilian19
  • Joined Jan 2011 | Status: Currently in Asia | 839 Posts

Disclaimer: "This is just a collection of Mr. Pips (http://www.forexfactory.com/showthread.php?p=6322687) thread. Please do not post here!


http://www.forexfactory.com/showthre...14#post6322714

Post# 5 Dec 26, 2012 7:24pm

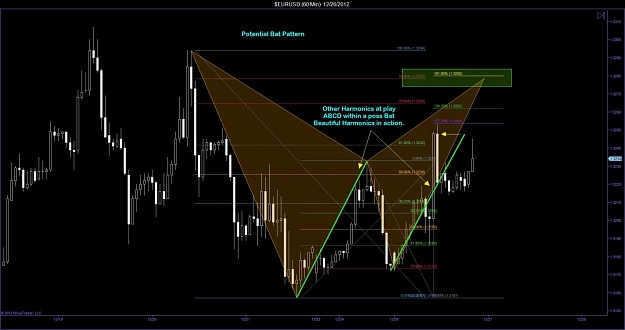
A taste of things to come. Enjoy the chart!
Attached Image (click to enlarge)
Click to Enlarge

Name: $EURUSD (60 Min)  12_26_2012.jpg
Size: 90 KB
1
  • Post #5
  • Quote
  • Jan 3, 2013 8:36pm Jan 3, 2013 8:36pm
  •  Kilian19
  • Joined Jan 2011 | Status: Currently in Asia | 839 Posts

Disclaimer: "This is just a collection of Mr. Pips (http://www.forexfactory.com/showthread.php?p=6322687) thread. Please do not post here!


http://www.forexfactory.com/showthre...25#post6322725

Post#6 Dec 26, 2012 7:35pm

Quote
Disliked
Looking forward to your input. Perhaps your harmonics are what I am considering as waves.

Best wishes

I am not in tune with wave theory. The whole thing opens up to subjectivity which is an aspect I have removed from my trading. We will discuss swings but the process has been simplified. I keep things simple because I believe it’s in our nature to complicate everything.

I trade what I see not what I think. We will begin the process of identifying on a chart where decisions are made. We do not chase price around we wait for it to come to us. This adds to the value of the setup because it validates our analysis. PRZ (Price Reversal Zones) are magical places you will come to love.

Regards,

Mr. Pip.
  • Post #6
  • Quote
  • Jan 3, 2013 8:38pm Jan 3, 2013 8:38pm
  •  Kilian19
  • Joined Jan 2011 | Status: Currently in Asia | 839 Posts

Disclaimer: "This is just a collection of Mr. Pips (http://www.forexfactory.com/showthread.php?p=6322687) thread. Please do not post here!


http://www.forexfactory.com/showthre...59#post6322759

Post# 8 Dec 26, 2012 8:06pm

I made this short video a while back for a group I was mentoring. It is a great foundation we can build on. View the video on Fibs and Harmonics.

Regards,

Mr. Pip

Inserted Video
  • Post #7
  • Quote
  • Jan 3, 2013 8:40pm Jan 3, 2013 8:40pm
  •  Kilian19
  • Joined Jan 2011 | Status: Currently in Asia | 839 Posts

Disclaimer: "This is just a collection of Mr. Pips (http://www.forexfactory.com/showthread.php?p=6322687) thread. Please do not post here!


http://www.forexfactory.com/showthre...54#post6322854

Post# 9 Dec 26, 2012 9:45pm

Let’s talk about areas of confluence. Confluence areas are where trading decisions are made. In these areas positions are covered and others are opened. They are by far the best areas for high probability trade setups.


It is a coming together of different technical tools that adds tremendous strength in the decisive nature of price movement. The more elements that meet at a specific place and time the stronger the hurtle for price to overcome. Price often takes the path of least resistance.


The market is what is it is, the collective sum of its participants. It is an impossibility for anyone person to think what any one trader is thinking much less the millions that trade it. It is an emotional machine steered by the 2 most basic human emotions fear and greed. Confluence helps us identify where traders collectively have the highest probability to make these decisions with unprecedented precision. The chart below shows the power of confluence.


What is involved in areas of confluence?


Support/Resistance, Fib Ratios, Fib Ext., Harmonic Patterns and on occasion trend lines. We are always building a case for entry. There must always be a reason for getting into a trade. If you cannot answer why you want to take this trade then you should not take that trade.

Regards,


Mr. Pip
Attached Image (click to enlarge)
Click to Enlarge

Name: $EURUSD (60 Min)  12_26_2012 (1).jpg
Size: 95 KB
  • Post #8
  • Quote
  • Jan 3, 2013 8:43pm Jan 3, 2013 8:43pm
  •  Kilian19
  • Joined Jan 2011 | Status: Currently in Asia | 839 Posts

Disclaimer: "This is just a collection of Mr. Pips (http://www.forexfactory.com/showthread.php?p=6322687) thread. Please do not post here!


http://www.forexfactory.com/showthre...76#post6322876

Post# 11 Dec 26, 2012 10:28pm


I don’t expect you to understand this yet but I like to show chart examples. I just want you to see the confluence. When and if price gets to the PRZ the market will be overbought and there are simply too many obstacles for price to overcome.

I will not confuse you with fancy supply and demand terminology and will keep things simple for the newer folks here. The expectation is for weakness to give way to strength. The bears will be waiting here for an opportunity to take price lower. The path of least resistance will likely prevail.

Don’t focus on this pattern too much just want to show you a current example of confluence at a pattern completion point. We will get into patterns and harmonics later on.

Regards,

Mr. Pip
Attached Image (click to enlarge)
Click to Enlarge

Name: $EURUSD (60 Min)  12_26_2012 (2).jpg
Size: 105 KB
  • Post #9
  • Quote
  • Jan 3, 2013 8:46pm Jan 3, 2013 8:46pm
  •  Kilian19
  • Joined Jan 2011 | Status: Currently in Asia | 839 Posts

Disclaimer: "This is just a collection of Mr. Pips (http://www.forexfactory.com/showthread.php?p=6322687) thread. Please do not post here!


http://www.forexfactory.com/showthre...30#post6322930

Post# 15 Dec 26, 2012 11:32pm


Quote
Disliked
Posted by Bary
I didn't see that bat pattern. Don't know them very well yet.
Here's what I had before you posted your chart w/bat pattern.


The patterns will come with time. If your point C holds then yes a continuation to the down side is likely. There is definitely some structure for price to contend with at that level but at present we are in a bullish order flow environment.
  • Post #10
  • Quote
  • Edited at 9:29pm Jan 3, 2013 8:48pm | Edited at 9:29pm
  •  Kilian19
  • Joined Jan 2011 | Status: Currently in Asia | 839 Posts

Disclaimer: "This is just a collection of Mr. Pips (http://www.forexfactory.com/showthread.php?p=6322687) thread. Please do not post here!


http://www.forexfactory.com/showthre...70#post6323770

Post# 43 Dec 27, 2012 9:53am

I think now is a good time to discuss swings. We will not get into counting waves as these patterns do not call for this type of analysis. I believe wave may add value in adding further confirmation but it is not required to identify the patterns we will be looking at.


We look for price to be within a high and a low of a swing this is what I refer to a dominant swing. We also look for sore thumb high and a low. I refer to this as the main swing and always have the dominant swing within it. We use our Fib tool to measure these swings and start the process of finding confluence and pattern identification. I will show you some chart examples. There is no need to over think this process or identify a bunch of swings in the process. This may need further discussion but I will hold to see what kind of questions come up.


The first chart is one you are already familiar with.


The second shows a main swing and a dominant swing. I wanted you to see the relationship between the swings.


Regards,


Mr. Pip


http://www.forexfactory.com/showthre...17#post6326717

Post# 169 Dec 28, 2012 1:02pm

Once you have identified the main swing (no higher high or lower low) and that swing has a retracement of at least a 38% the dominant swing cannot (he meant can now) be established.
Attached Images (click to enlarge)
Click to Enlarge

Name: $EURUSD (60 Min)  12_27_2012.jpg
Size: 110 KB Click to Enlarge

Name: $USDCHF (240 Min)  12_27_2012.jpg
Size: 71 KB
  • Post #11
  • Quote
  • Edited at 9:26pm Jan 3, 2013 9:03pm | Edited at 9:26pm
  •  Kilian19
  • Joined Jan 2011 | Status: Currently in Asia | 839 Posts

Disclaimer: "This is just a collection of Mr. Pips (http://www.forexfactory.com/showthread.php?p=6322687) thread. Please do not post here!


http://www.forexfactory.com/showthre...55#post6324655

Post# 80 Dec 27, 2012 3:58pm


It has been mentioned and eluted to that how often do these patterns occur and if it is missed one could look to a different time frame. As I mentioned in the beginning, harmonics have no boundaries they apply to any timeframe or instrument. The question is really what are you comfortable with? How busy do you want to be and how much chart time do you have as a trader?


You have to address this early in your career. What are your hours of operation? Then you can identify a timeframe that gives you the best possibilities based on whatever system you chose to trade. It makes little sense that if you only have two hours in a day to trade that you look for setups on a 4H chart. Sure they will come but you will miss a lot more then you grab. Make sense?
  • Post #12
  • Quote
  • Jan 3, 2013 9:05pm Jan 3, 2013 9:05pm
  •  Kilian19
  • Joined Jan 2011 | Status: Currently in Asia | 839 Posts

Disclaimer: "This is just a collection of Mr. Pips (http://www.forexfactory.com/showthread.php?p=6322687) thread. Please do not post here!


http://www.forexfactory.com/showthre...45#post6325045

Post# 96 Dec 27, 2012 8:33pm

This is the proper way to analyze a Bat Pattern.
Attached Image (click to enlarge)
Click to Enlarge

Name: ANATOMY OF A BAT.jpg
Size: 132 KB
  • Post #13
  • Quote
  • Jan 3, 2013 9:07pm Jan 3, 2013 9:07pm
  •  Kilian19
  • Joined Jan 2011 | Status: Currently in Asia | 839 Posts

Disclaimer: "This is just a collection of Mr. Pips (http://www.forexfactory.com/showthread.php?p=6322687) thread. Please do not post here!


http://www.forexfactory.com/showthre...57#post6325057

Post# 99 Dec 27, 2012 8:45pm


Inserted Video
1
  • Post #14
  • Quote
  • Jan 3, 2013 9:12pm Jan 3, 2013 9:12pm
  •  Kilian19
  • Joined Jan 2011 | Status: Currently in Asia | 839 Posts

Disclaimer: "This is just a collection of Mr. Pips (http://www.forexfactory.com/showthread.php?p=6322687) thread. Please do not post here!


http://www.forexfactory.com/showthre...89#post6326389

Post# 159 Dec 28, 2012 10:54am

Let’s discuss how we apply ratios to swings and begin the process of identifying potential patterns.

We will begin with the Gartley that just completed since it’s fresh in our minds.

I will do this in a few posts step by step so we go not get confused.

The first thing we need to identify is a main swing. This is a swing that is obvious just by looking at it, 100 out of 100 people would have to agree on the high and the low.

Once this is identified we have to know that there is a high likelihood that it will at some point become an anchor leg to an advance pattern. It is important to take a look at previous swings to make sure this swing is not part of a pattern already in formation. This can happen if you have not been following the pair and just opened the chart.

Remember I said that it is not uncommon to see patterns within patterns and back to back patterns this happens a lot we just saw it here; just yesterday we had a bat pattern and now a Gartley. So just take a look and make sure you validate your swing as a potential anchor leg.

In the next post we will measure this with our fib tool.
Attached Image (click to enlarge)
Click to Enlarge

Name: $EURUSD (60 Min)  12_28_2012 1.jpg
Size: 74 KB
  • Post #15
  • Quote
  • Jan 3, 2013 9:14pm Jan 3, 2013 9:14pm
  •  Kilian19
  • Joined Jan 2011 | Status: Currently in Asia | 839 Posts

Disclaimer: "This is just a collection of Mr. Pips (http://www.forexfactory.com/showthread.php?p=6322687) thread. Please do not post here!


http://www.forexfactory.com/showthre...55#post6326455

Post# 161 Dec 28, 2012 11:19am

We can now draw our Fibonacci retracement lines from the low to the high of the main swing. This first retracement is the most important as it will identify what potential pattern or patterns we are looking at. Also, we can begin the process of elimination. Depending on this correction other patterns will be discarded.

So now our focal point become between the 38% and the 78% correction of the main swing. Price has to close somewhere in this zone and form a low. This low cannot be taken out by a lower close or all patterns become invalid and the process starts all over. Keep in mind that if this occurs, take a look at the previous swing because you could have missed something. Price has to stay within the confines of this zone! This correction will become point B or C of any pattern. Sorry the chart should say B or C in the green cube.
Attached Image (click to enlarge)
Click to Enlarge

Name: $EURUSD (60 Min)  12_28_2012 2.jpg
Size: 97 KB
  • Post #16
  • Quote
  • Jan 3, 2013 9:15pm Jan 3, 2013 9:15pm
  •  Kilian19
  • Joined Jan 2011 | Status: Currently in Asia | 839 Posts

Disclaimer: "This is just a collection of Mr. Pips (http://www.forexfactory.com/showthread.php?p=6322687) thread. Please do not post here!


http://www.forexfactory.com/showthre...57#post6326557

Post# 163 Dec 28, 2012 11:51am

Now that we have our first correction we can establish it as the dominant swing. I use this terminology because it has dominance over deciding what patterns we will discard and which one we will keep on the table. It also has price action trapped within its high and low so it also has dominance on price action. We now know we are dealing with a Gartley, Crab or ABCD all others are discarded per my rules of engagement as the close fell between the 50% and the 61%.

In the next post a Fibonacci will be extend from the high to the low to further define our pattern. We already know it can only be one of three so the process simplifies as price progresses.
Attached Image (click to enlarge)
Click to Enlarge

Name: $EURUSD (60 Min)  12_28_2012 3.jpg
Size: 97 KB
  • Post #17
  • Quote
  • Jan 3, 2013 9:17pm Jan 3, 2013 9:17pm
  •  Kilian19
  • Joined Jan 2011 | Status: Currently in Asia | 839 Posts

Disclaimer: "This is just a collection of Mr. Pips (http://www.forexfactory.com/showthread.php?p=6322687) thread. Please do not post here!


http://www.forexfactory.com/showthre...33#post6326633

Post# 165 Dec 28, 2012 12:19pm

We can now extend the Fibonacci retracement line from the high and low of the dominant swing. Every swing in the process has its own role in helping us further validate the pattern that is forming. This swing will also iron down our unknown X,A,B,C.

To achieve this we use a conditional thought process our approach should always be an IF=Then process. Let me explain this a bit more. If this happens then I will do this.There is no guessing involved no subjectivity.

If the high of the dominant swing is taken out by a break above close above then the Gartley and Crab are discardedand we are looking at an ABCD.

If price retraces to the green cube then we are looking at a Gartley Pattern.

If price retraces in the dark pink cube then we are lookingat a Crab Pattern.

As you can see price pierced the 61.8 making it a Gartley Pattern and we can identify points X,A,B,C.

Our next post we will identify where point D should terminate and identify the all so important PRZ.
Attached Image (click to enlarge)
Click to Enlarge

Name: $EURUSD (60 Min)  12_28_2012 4.jpg
Size: 106 KB
  • Post #18
  • Quote
  • Jan 3, 2013 9:20pm Jan 3, 2013 9:20pm
  •  Kilian19
  • Joined Jan 2011 | Status: Currently in Asia | 839 Posts

Disclaimer: "This is just a collection of Mr. Pips (http://www.forexfactory.com/showthread.php?p=6322687) thread. Please do not post here!


http://www.forexfactory.com/showthre...64#post6326664

Post# 167 Dec 28, 2012 12:33pm


Great we are almost there. We know we are looking at a Gartley and we need to identify where D is suppose to be and identify our PRZ.

D is by the rules of engagement and area of confluence between the anchor leg XA of 78.6 and a 127 extention of AB.

So now we have D identified great so this is where thepattern completes. Now we have to see what other harmonic element we can utilize to form the PRZ

We will do this in the next post.
Attached Image (click to enlarge)
Click to Enlarge

Name: $EURUSD (60 Min)  12_28_2012 5.jpg
Size: 106 KB
  • Post #19
  • Quote
  • Jan 3, 2013 9:23pm Jan 3, 2013 9:23pm
  •  Kilian19
  • Joined Jan 2011 | Status: Currently in Asia | 839 Posts

Disclaimer: "This is just a collection of Mr. Pips (http://www.forexfactory.com/showthread.php?p=6322687) thread. Please do not post here!


http://www.forexfactory.com/showthre...06#post6326706

Post# 168 Dec 28, 2012 12:57pm

The PRZ is a magical place. This is where decisions are made and often fast. Price generally does not hang around here long. We don’t have a rule for how valid a PRZ is but the more confluence of harmonics and structure line up at a pattern completion point the stronger that PRZ becomes and also the reaction to price.

In this pattern we had the following:

We know price is to begin with at an exhaustion point (oversold by Fib extension).

We have nice confluence at D (78.6 and 127).

We have a Harmonic AB=CD Blue line.

We had a 138 Fib extension lining up with structure.

We now throw a cube around this area and bam the PRZ.

This particular PRZ had four areas of confluence and sometimes there may only be the pattern. The more you find the stronger the PRZ becomes. Don’t feel the pattern is any less tradable if it’s the only confluence you can find in the PRZ.

Well my friends you can see how we build a case for entry and have plenty of reasons to engage the market.

We identified weakness with harmonics and ratios and took advantage of a very high probability trade.

Are there any questions? Do I need to go over anything again?

Maybe tonight or tomorrow we will get into the PRZ
Attached Image (click to enlarge)
Click to Enlarge

Name: $EURUSD (60 Min)  12_28_2012 6.jpg
Size: 117 KB
  • Post #20
  • Quote
  • Jan 3, 2013 9:37pm Jan 3, 2013 9:37pm
  •  Kilian19
  • Joined Jan 2011 | Status: Currently in Asia | 839 Posts

Disclaimer: "This is just a collection of Mr. Pips (http://www.forexfactory.com/showthread.php?p=6322687) thread. Please do not post here!


http://www.forexfactory.com/showthre...38#post6327438

Post# 207 Dec 29, 2012 7:52am

Structure is an area of support/resistance. These areas tend to act as future support/resistance again and again. To have structure in confluence with a ratio as confluence is very powerful. let me know if you need a better cleaner example so I can find one. Thank you for your question.
Attached Image (click to enlarge)
Click to Enlarge

Name: $EURUSD (60 Min)  12_28_2012.jpg
Size: 94 KB
  • Trading Journals
  • /
  • "Ratios & Harmonics: a Different Way to Trade." Summary
  • Reply to Thread
    • Page 1 2
    • Page 1 2
0 traders viewing now
  • More
Top of Page
  • Facebook
  • Twitter
About FF
  • Mission
  • Products
  • User Guide
  • Media Kit
  • Blog
  • Contact
FF Products
  • Forums
  • Trades
  • Calendar
  • News
  • Market
  • Brokers
  • Trade Explorer
FF Website
  • Homepage
  • Search
  • Members
  • Report a Bug
Follow FF
  • Facebook
  • Twitter

FF Sister Sites:

  • Metals Mine
  • Energy EXCH
  • Crypto Craft

Forex Factory® is a brand of Fair Economy, Inc.

Terms of Service / ©2021