No two people have the same level of risk. Here is an example but you can make up your own. Suppose the target based on mouteki looks for a 90 pip gain and you want a 3:1 risk versus reward - then your risk is 30 pips. So on a short put your exit at 30 pips above your short entry. What I do to control my risk is when I have a 1:1 profit of 30 pips I sell 1/3 of my position and move my stop to my original entry. This eliminates turning a profit turning into a loss. I can sell my my second third at a profit of 60 pips if my stop is never hit and let the final third ride down to the target if that allows or exit at my discretion.
In addition to the previous post, demand and supply trends form a good indication of the price movement.<?xml:namespace prefix = o ns = "urn:schemas-microsoft-com:office:office" /><o></o>
<o></o>
When demand and supply trends cross, different scenarios can be viewed as follow:<o></o>
<o></o>
Zone A : price is at this zone is consolidation stage where ranging do happen. If the price between two trends are quite far apart, then price ranging can occur many times until the trend price differences narrow down to less than 50 pips take as an example. The trends are not fixed as they will adjust by the trader on every H4. The slope of the trend also determines the price movement, the higher anger of the slope toward vertical line the better chances of the price direction confirmation once its break the trend. The trend with close to horizontal line is either oversold/overbought for supply/demand trend, hence any break through on the opposite trend line or price escalating toward the opposite trend will likely have big projected profit. A good example to EURUSD happen on 25<SUP>th</SUP> Sep.
<o></o>
Zone B: Price at this zone is when price above both trends. The price is likely to reach the projected profit on the long trade. A new trend pattern can change the situation quickly within a day, so it is good to have one good long trade only but no swing trade. AUDUSD is another example happen on 25<SUP>th</SUP> Sep.
<o></o>
Zone C: Price in this zone is the most noisy zone as there is no clear direction of the price until a new set of trend is formed. It is also good to know such zone so that its about time to relax and wait for the clearer picture.
<o></o>
Zone D: The opposite of Zone B where short trade is recommended. EURJPY is another example on 25tth Sep. Somehow for zone B and D, the wider anger on both trend, the lesser project profit for which I can’t explain to it.
<o></o>
For any chart where there is only one trend which may signal the price is in swing direction in accordance to the trend direction. But it is also good to catch the profit along the ranging direction.
<o></o>
For any currency pairs relate to JPY, the pattern and trend is more uncertain due to too much noise interruption, hence I will not try to trade any one of them if possible.
<o></o>
Finally the above explanation is my own observation which does not base on any scientific research or mathematic theory but purely using Mouteki strategy and other indicator to form the conclusion. You can use it on the backtest or forward test where you can feel the direction of the trend. I will not reply any comment on how I derive it or how I come to such conclusion.<o></o>
Ignored
This is an EXCELLENT observation. I think you've hit it on the nail. One question though, since I am not sure where you are from. When you are typing "anger", are you really meaning "angle" of the slope? I think so, but you wrote it many times, so I wasn't sure if anger meant something that I wasn't aware of.
can someone explain to me how we will get a pt of 460 pips on the cable going long. maybe i miss understood but i thought that when we make a price projection going long, we draw the supply line and make the price projection from the lowest low UNDER the trendline between the 2 pts that make up the trendline.
can someone explain to me how we will get a pt of 460 pips on the cable going long. maybe i miss understood but i thought that when we make a price projection going long, we draw the supply line and make the price projection from the lowest low UNDER the trendline between the 2 pts that make up the trendline.
Ignored
Hi,
Supply lines for GBP/USD have changed. This is how they looked on SEPT. 22nd. Had there been a supply line break (UPSIDE) our target would have been 460 pips.
It never opened above the supply line, and now the swing highs/lows have changed.
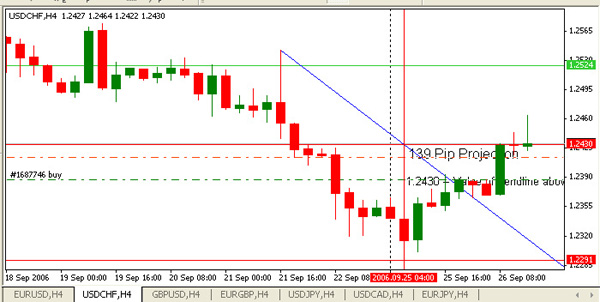
As mentioned before, profit on zone D is small and the price will move back toward the intersectional trend but slowly. If it takes more than 2 H4 to do it, then a new trend lines are form and forcing the price to fall into zone A which may heading south again due to the previous supply trend near horizontal line ( that is overbought or resistance level ).
I am referring to GBPUSD.
Ignored
OK, what about this BULL flag pattern developing? Is it possible it could hit 1.8895 in zone D?