• Home
  • Forums
  • Trades
  • News
  • Calendar
  • Market
  • Brokers
  • Login
  • Join
  • User/Email: Password:
  • 10:19pm
Menu
  • Forums
  • Trades
  • News
  • Calendar
  • Market
  • Brokers
  • Login
  • Join
  • 10:19pm
Sister Sites
  • Metals Mine
  • Energy EXCH
  • Crypto Craft

Options

Bookmark Thread

First Page First Unread Last Page Last Post

Print Thread

Similar Threads

Auction Market Theory and Market Profile 21,648 replies

MarketProfile/Volume Profile/Auction Market Theory indi? 17 replies

ECN && STP && Scalping && Hedging - Broker Review - Oct 2009 24 replies

Auction Market Value Analytics Charts & Data 14 replies

Analytics, recommendations - S&P 500, Euro and other 11 replies

  • Trading Discussion
  • /
  • Reply to Thread
  • Subscribe
  • 1,023
Attachments: Auction Market Value Theory & Analytics
Exit Attachments
Tags: Auction Market Value Theory & Analytics
Cancel

Auction Market Value Theory & Analytics

  • Last Post
  •  
  • 1 6364Page 656667 81
  • 1 64Page 6566 81
  •  
  • Post #1,281
  • Quote
  • Edited 1:37pm Jan 4, 2018 1:26pm | Edited 1:37pm
  •  mzvega
  • Joined May 2009 | Status: Member | 1,879 Posts
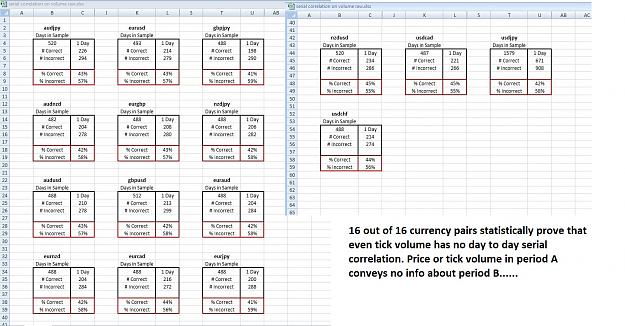
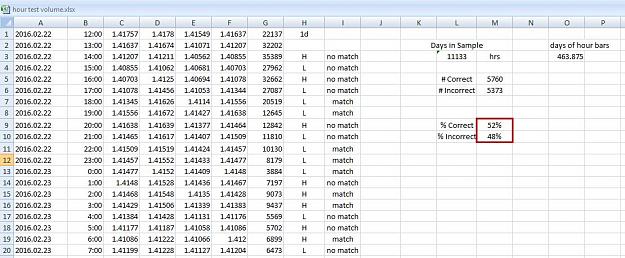
I thought I would include tick volume, before I move on to my next point and yes mav3n, no serial correlation using hourly data either.
Attached Image(s) (click to enlarge)
Click to Enlarge

Name: volume groups.JPG
Size: 387 KB
Click to Enlarge

Name: hourly volume.JPG
Size: 134 KB
Attached File(s)
File Type: xlsx serial correlation on volume.xlsx   1.6 MB | 165 downloads
File Type: xlsx hour test volume.xlsx   768 KB | 160 downloads
Markets are not efficient, rather they are effective - Jones
 
3
  • Post #1,282
  • Quote
  • Jan 5, 2018 12:31am Jan 5, 2018 12:31am
  •  mzvega
  • Joined May 2009 | Status: Member | 1,879 Posts
Why do people use Candlesticks? Why are they plotted sequentially one right after another in a series? Because there's that underlying belief in serial correlation, that prices in period A have something to tell traders about prices in period B.

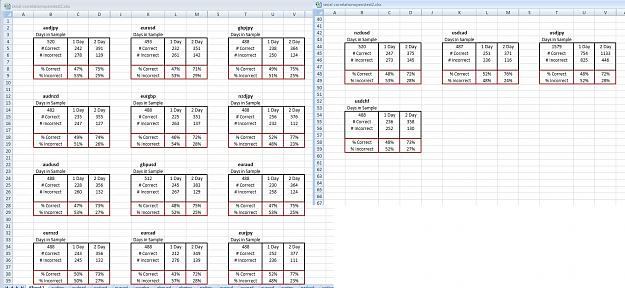
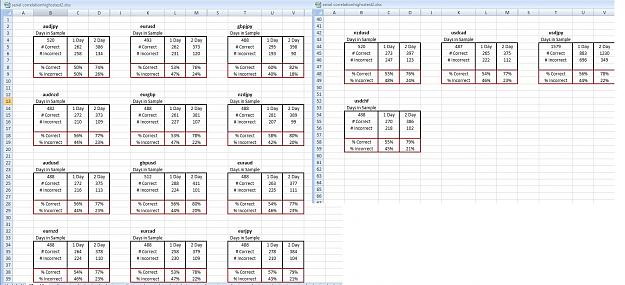
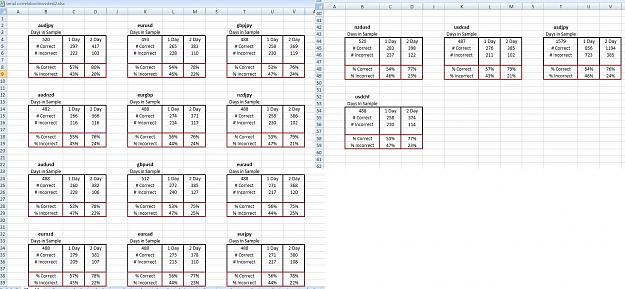
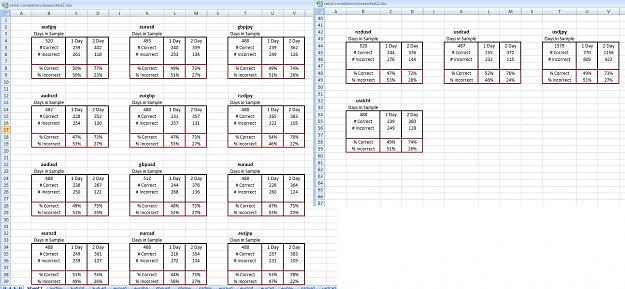
Evidence proves that there is no serial correlation. The notion that prices in period A that have something to tell traders about prices in period B is only correct about 50% of the time………It does not prove that the market is a random walk……..

Let's see how well the statistics change when you simply change the way you think…….

If you accept the fact that there is no serial correlation, and because the market is non linear, it is not logical to view the market in a linear series. Let's look at the data again, using a 2 day sample of data rather than a linear time series of individual candlesticks………

The statistics increase by about 20% when you simply change the way you think………

On opens......
Attached Image (click to enlarge)
Click to Enlarge

Name: opens.JPG
Size: 411 KB

on highs.......
Attached Image (click to enlarge)
Click to Enlarge

Name: highs.JPG
Size: 404 KB

on lows..................
Attached Image (click to enlarge)
Click to Enlarge

Name: lows.JPG
Size: 378 KB

on closes........................
Attached Image (click to enlarge)
Click to Enlarge

Name: closes.JPG
Size: 404 KB

Why are the statistics better? When you use non linear measures, in a non linear environment you have a more accurate measure of the environment.
Non linear data can not be plotted using Time Series, as the data is not linear and not a series.

The market is reported as ticks, Price and the time in which it occurred (2D)
What happens next is the data is "subjectively" broken into TF's ( 1m, 5m, 15m, and 30m.etc.) depending on the viewer. This artificially skews the data. Each place where the data has been "subjectively" broken into TF's creates a artificial high and a low. This is "subjective" info because it is biased by the observer's choice of TF. Already you have "flaws" in your data set. You are now using data "once removed" from its original market generated Price *Time format.

As I mentioned before
Tick data does not have an open, high, low, or close quote it simply tells the previous price. The OHLC quotes occur only after tick data has been collected and coerced into interval data, such as one minute, one hour, one day, or any other selected duration". the forex charting companion -Archer
Pasted from <https://www.forexfactory.com/showthr...6#post10357556>

Now that the data has subjectively been broken into TF's. The data inside the timeframe(candlestick) is now "sorted" (rearranged) into a linear "series" from high to low forming a bar/candle. Now you have skewed your data set once again. Remember the tick data didn't start out as a linear series. Now your data is "twice removed" from it's original context (market generated price *time format) Your candlestick TF's only look like a "series" of prices from high to low, because you manipulated the data to do so.
Pasted from <https://www.forexfactory.com/showthr...d#post10525173>

The use of candles ticks & bar charts are non permitted practices in AMVT, the market is obviously non linear, and price changes in period A convey no info about price changes in period B, in other word meaningless……….

I'd love to throw up a chart, but the data doesn't live on the chart, It's impossible to plot non linear data, using a linear display. I find it interesting how so many people conflate charting & visualization with actual analysis.

The data exists, it just doesn't live on the chart………
the statistics prove there is no day to day, hour to hour, serial correlation in the market and the statistics show that by no means is it a Random Walk either.

The statistics increase by about 20% when you simply change the way you think………
Attached File(s)
File Type: xlsx serial correlation closes.xlsx   1.6 MB | 203 downloads
File Type: xlsx serial correlation highs.xlsx   1.6 MB | 168 downloads
File Type: xlsx serial correlation lows.xlsx   1.6 MB | 167 downloads
File Type: xlsx serial correlation opens.xlsx   1.6 MB | 187 downloads
Markets are not efficient, rather they are effective - Jones
 
5
  • Post #1,283
  • Quote
  • Edited 2:54am Jan 5, 2018 2:14am | Edited 2:54am
  •  mav3n
  • | Joined Sep 2015 | Status: Member | 207 Posts
Dear MzVega, this is very interesting!

I have few questions :
1. So when we add the number of the days (more than one day), the random walk start to disappear, am i correct?

2. If the daily data is presented as follow A > B > C > D > E > ......., can we rephrase the common believe into this sentence "Prices in period A have something to tell traders about prices in period C, Prices in period B have something to tell traders about prices in period D"? Is this mindset correct?

3. If question number 2 is correct, doesn't it mean that there is still a "serial correlation" between today data and the data from two days ago?

4. Can we read a useful information if we can display a 2D (2 Days) candlestick on a chart? What i mean is one candlestick represent 2 days OHLC.

5. How many days are optimal in determining the condition of the next sequence? I try to edit your excel files formula and find that 3 days is optimal, when i try to calculate 4 and 5 days, the percentage decreased. Forgive me if i make mistake in editing the formula, i just changed the value of the "I" Column, into something like this =IF(F5>F2,"H",IF(F5<F2,"L",IF(F5=F2,"0",""))) (3 days comparation)


Thanks
Attached Image (click to enlarge)
Click to Enlarge

Name: 3 4 5 days.jpg
Size: 61 KB
 
 
  • Post #1,284
  • Quote
  • Jan 5, 2018 3:18am Jan 5, 2018 3:18am
  •  mav3n
  • | Joined Sep 2015 | Status: Member | 207 Posts
I also curious to see the average accuracy between the open, high, low and close data. I add all the percentage and divided it with 16 (16 pairs).
I saw that High and Low give a little bit more percentage in being correct. Did this provide significant information MzVega? Thanks in advanced!!

ps : it looks like 2 days give higher percentage of correlation then 3 days. Maybe i am wrong, dunno!!
Attached Image
 
 
  • Post #1,285
  • Quote
  • Edited 6:17pm Jan 5, 2018 12:28pm | Edited 6:17pm
  •  mzvega
  • Joined May 2009 | Status: Member | 1,879 Posts
Quoting mav3n
Disliked
Dear MzVega, this is very interesting! I have few questions : 1. So when we add the number of the days (more than one day), the random walk start to disappear, am i correct?
Ignored
When you increase the "sample" size of your data for analysis……..you can filter out some of the random component. But your missing the point,

Quoting mav3n
Disliked
2. If the daily data is presented as follow A > B > C > D > E > ......., can we rephrase the common believe into this sentence "Prices in period A have something to tell traders about prices in period C, Prices in period B have something to tell traders about prices in period D"? Is this mindset correct?
Ignored
OHLC (live market quotes) data are not formulated into a statistically measurable and logically sound arrangement of data which provides information…..
Not if those periods (a, b, c,etc) are candlesticks …….you are still attempting to analyze a linear "series" in a non linear environment
https://www.forexfactory.com/showthr...2#post10528862

Serial means one event at a time. It is usually contrasted with parallel, meaning more than one event happening at a time.
When you line your data up in a single row "serially" it is a linear measure, that resembles a "line" hence "linear" 1 dimensional, It's the nature of the data, it's always going to "look" serially correlated


Quoting mav3n
Disliked
4. Can we read a useful information if we can display a 2D (2 Days) candlestick on a chart? What i mean is one candlestick represent 2 days OHLC.
Ignored
When I used the abbrev. "2d" I assumed you were familiar with the thread, and some of the source material. When I used the abbrev. "2d" it was meant as "2 dimensional" price *time format, not a 2 day candlestick

Quoting mav3n
Disliked
How many days are optimal in determining the condition of the next sequence?
Ignored
See, there you go again........Stop thinking in "candlesticks", straight lines, timeseries & sequences. This isn't TA
https://www.forexfactory.com/showthr...1#post10525201

Quoting mav3n
Disliked
5. How many days are optimal in determining the condition of the next sequence?
Ignored
In AMVT using "market generated info"( not candlesticks), we employ a minimum 3 day rule for analysis. For the exact reason that you pointed out…….the data supports the theory, We employ 3 or more to allow room to identify small changes/movement the market generated info, not a series of candles…...
Markets are not efficient, rather they are effective - Jones
 
3
  • Post #1,286
  • Quote
  • Jan 5, 2018 8:08pm Jan 5, 2018 8:08pm
  •  mav3n
  • | Joined Sep 2015 | Status: Member | 207 Posts
Ouch!! I must really recalibrate my neuron!! Thanks MzVega!!
 
 
  • Post #1,287
  • Quote
  • Edited Jan 8, 2018 11:04am Jan 7, 2018 11:00pm | Edited Jan 8, 2018 11:04am
  •  mzvega
  • Joined May 2009 | Status: Member | 1,879 Posts
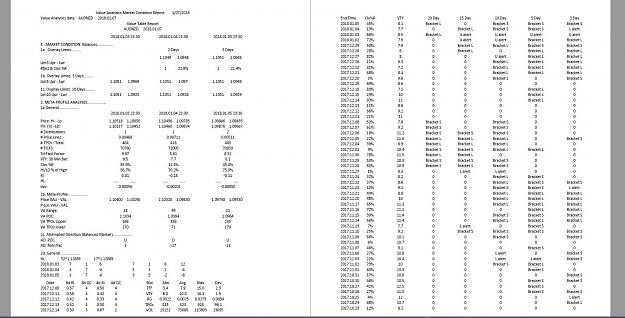
eurnzd (updated)
Attached Image (click to enlarge)
Click to Enlarge

Name: eurnzd.JPG
Size: 214 KB

(updated)
Attached Image (click to enlarge)
Click to Enlarge

Name: eurnzd updated.JPG
Size: 304 KB

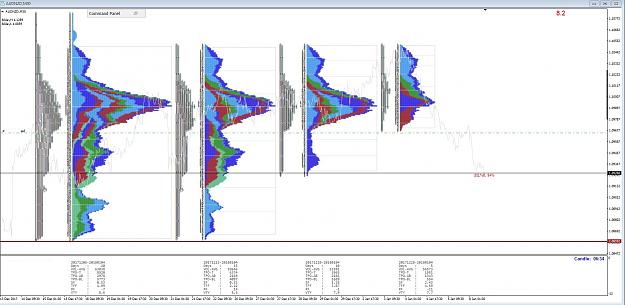
audnzd (updated)
Attached Image (click to enlarge)
Click to Enlarge

Name: audnzd.JPG
Size: 223 KB

(updated)
Attached Image (click to enlarge)
Click to Enlarge

Name: audnzd updated.JPG
Size: 365 KB
Markets are not efficient, rather they are effective - Jones
 
2
  • Post #1,288
  • Quote
  • Jan 8, 2018 11:03am Jan 8, 2018 11:03am
  •  mzvega
  • Joined May 2009 | Status: Member | 1,879 Posts
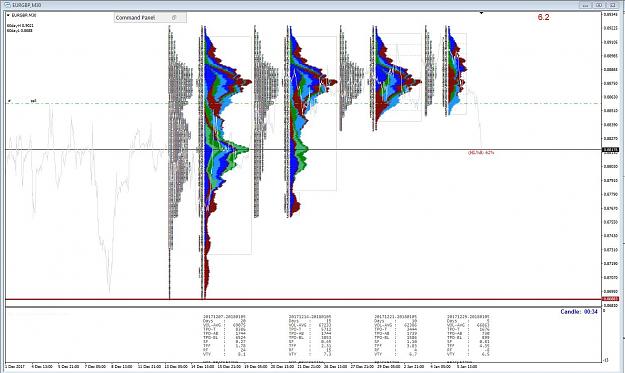
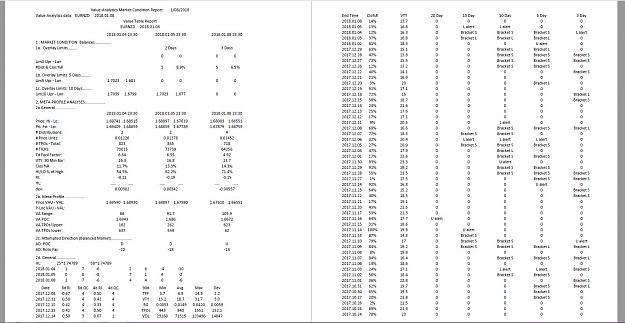
eurgbp
Attached Image(s) (click to enlarge)
Click to Enlarge

Name: eurgbp.JPG
Size: 235 KB
Click to Enlarge

Name: eurgbp1.JPG
Size: 275 KB
Markets are not efficient, rather they are effective - Jones
 
2
  • Post #1,289
  • Quote
  • Jan 9, 2018 3:16am Jan 9, 2018 3:16am
  •  mzvega
  • Joined May 2009 | Status: Member | 1,879 Posts
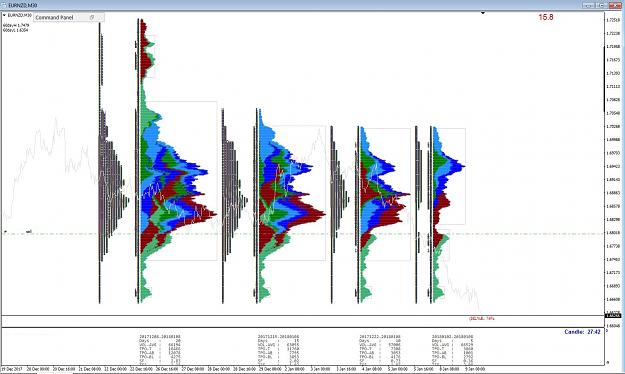
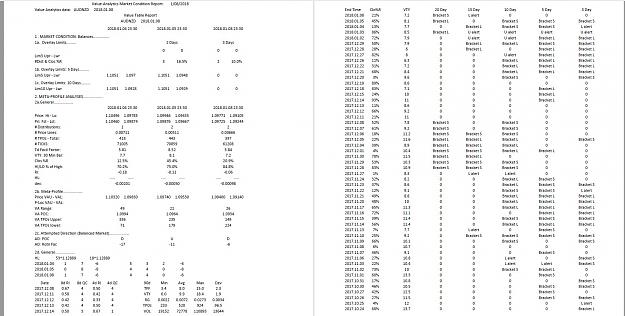
eurnzd (updated)
Attached Image(s) (click to enlarge)
Click to Enlarge

Name: eurnzd updated1.JPG
Size: 195 KB
Click to Enlarge

Name: eurnzd updated.JPG
Size: 270 KB
Markets are not efficient, rather they are effective - Jones
 
1
  • Post #1,290
  • Quote
  • Jan 9, 2018 11:06am Jan 9, 2018 11:06am
  •  mzvega
  • Joined May 2009 | Status: Member | 1,879 Posts
audnzd (updated)
Attached Image (click to enlarge)
Click to Enlarge

Name: audnzd1 updated.JPG
Size: 221 KB

Attached Image (click to enlarge)
Click to Enlarge

Name: audnzd updated.JPG
Size: 368 KB


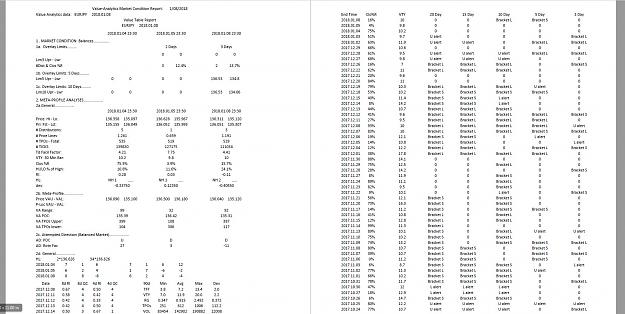
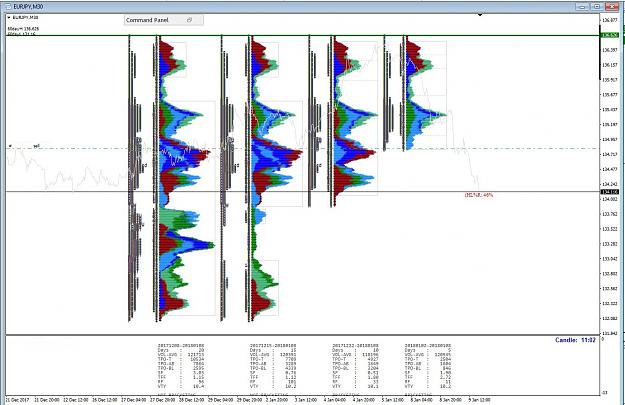
eurjpy
Attached Image (click to enlarge)
Click to Enlarge

Name: eurjpy1.JPG
Size: 224 KB

Attached Image (click to enlarge)
Click to Enlarge

Name: eurjpy.JPG
Size: 264 KB
Markets are not efficient, rather they are effective - Jones
 
2
  • Post #1,291
  • Quote
  • Jan 9, 2018 1:43pm Jan 9, 2018 1:43pm
  •  Trader-Waldo
  • | Membership Revoked | Joined Sep 2017 | 422 Posts
may I ask what is
Clos %R
on chart for example for EURGBP is written HL%R:62%
thank you.
NO MATTER THE SITUATION,NEVER LET YOUR EMOTIONS OVERPOWER YOUR INTELLIGENCE
 
1
  • Post #1,292
  • Quote
  • Edited 4:02pm Jan 9, 2018 3:43pm | Edited 4:02pm
  •  mzvega
  • Joined May 2009 | Status: Member | 1,879 Posts
Quoting Trader-Waldo
Disliked
may I ask what is Clos %R on chart for example for EURGBP is written HL%R:62% thank you.
Ignored
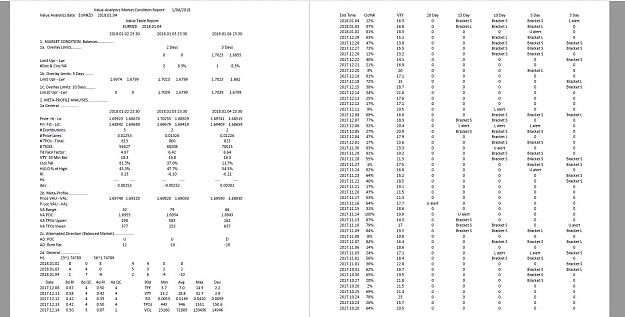
close as a % of range (is used in my EOD analysis) it is not plotted on the chart.

What you see on the chart, It is not the same thing. You will see it is on my EOD analysis as Hi/Lo %H

I had asked someone to create an indicator Hi/Lo %H (something different than Clo% R), however, it never match my #'s when worked out by hand. Eventually I open the indicator, & corrected the math however I didn't change the static "text" placed there by the original creator. It should read "Hi/Lo %H".

Due to lack of interest concerning the topic of the thread, it just seemed like a waste of time to go through and change all my "templates" for the benefit of the uninterested......
Markets are not efficient, rather they are effective - Jones
 
2
  • Post #1,293
  • Quote
  • Jan 10, 2018 10:04am Jan 10, 2018 10:04am
  •  mzvega
  • Joined May 2009 | Status: Member | 1,879 Posts
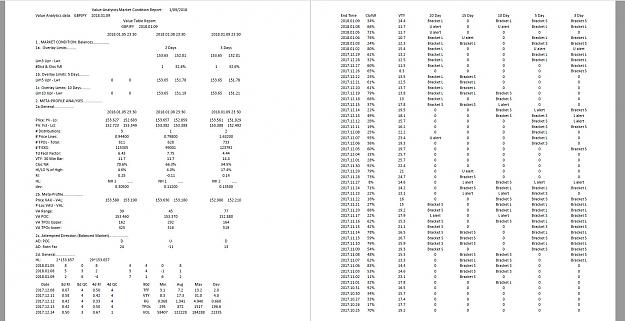
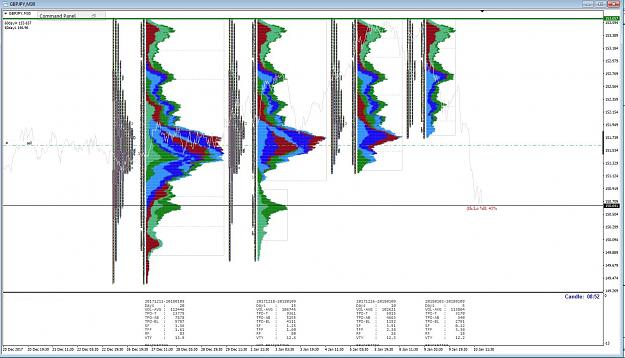
gbpjpy
Attached Image(s) (click to enlarge)
Click to Enlarge

Name: gbpjpy1.JPG
Size: 239 KB
Click to Enlarge

Name: gbpjpy.JPG
Size: 331 KB
Markets are not efficient, rather they are effective - Jones
 
1
  • Post #1,294
  • Quote
  • Jan 10, 2018 11:22am Jan 10, 2018 11:22am
  •  TraderFox27
  • | Joined Jan 2018 | Status: Member | 5 Posts
Dear All,

I have been a quiet follower of this thread for some time now and I would like to thank MzVega for sharing all this brilliant information.

I read through MOM, VBPT and every single post in this forum. It is a lengthy process indeed but nothing worth having comes easy I guess.

Now my next goal is to go through the CISCO website and read all the information that is on there. I have read a few of the articles already, however, since the website is by no means structured in any chronological order I had a hard time finding all the relevant articles. What I did is the following: I went through all the links on the website numerous times and saved everything into a PDF. After deleting all the articles that I had saved out more than once merged all the articles into one single file. Furthermore, I created a Table of Contents which I will attach to this post in the hope that someone could have a look at it and tell me if I am missing anything. I would really appreciate it! Then I plan to upload the whole PDF(1456 pages at the moment) to the thread so that all the materials are there and no one has to assemble them by him/herself again, which in my humble opinion is quite a painstaking process. I hope you like the idea.

I really liked the posts on the topic of serial correlation. I read the article by Jones before, but your explanation and evidence were really clear and to the point. May I add that even if there is a slightly higher chance to be correct if you focus on Highs and Lows instead of Open/Close, you still won't be able to tell where the High/Low is gonna be. That only becomes apparent after the fact and will most likely screw your risk/reward ratio.

Best Wishes to all of you.
Attached File(s)
File Type: pdf CISCOTableOfContents.pdf   98 KB | 374 downloads
 
3
  • Post #1,295
  • Quote
  • Jan 10, 2018 11:26am Jan 10, 2018 11:26am
  •  mzvega
  • Joined May 2009 | Status: Member | 1,879 Posts
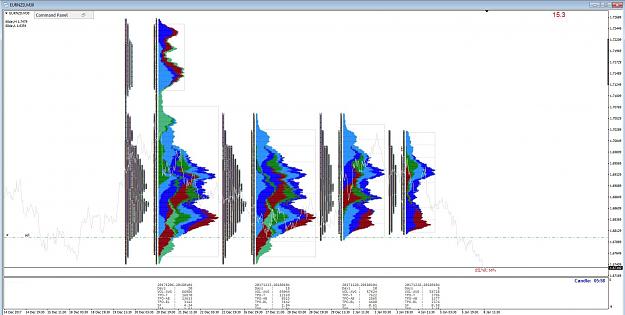
audjpy
Attached Image(s) (click to enlarge)
Click to Enlarge

Name: audjpy1.JPG
Size: 217 KB
Click to Enlarge

Name: audjpy.JPG
Size: 282 KB
Markets are not efficient, rather they are effective - Jones
 
 
  • Post #1,296
  • Quote
  • Jan 11, 2018 11:41am Jan 11, 2018 11:41am
  •  mzvega
  • Joined May 2009 | Status: Member | 1,879 Posts
Quoting TraderFox27
Disliked
Dear All, I have been a quiet follower of this thread for some time now and I would like to thank MzVega for sharing all this brilliant information. I read through MOM, VBPT and every single post in this forum. It is a lengthy process indeed but nothing worth having comes easy I guess. Now my next goal is to go through the CISCO website and read all the information that is on there. I have read a few of the articles already, however, since the website is by no means structured in any chronological order I had a hard time finding all the relevant...
Ignored
I just want to apologize for not responding sooner to your post, I attempted to send you a quick PM to let you know I was pressed for time this week and unable to properly address your post with the attention it deserves. Outside of my trading we have a business, which I rarely take part in…….Long story short our office manager/bookkeeper took the first week of the new year for vacation……So this week the majority of my time is outside my home office, holding the fort down there. I barely had time to post a few trades.

I am sure any contributions you make here would be appreciated by those with a genuine interest…I have not had the time to look at your table of contents with great detail however it looks great. I appreciate that you liked the topic of serial correlation, I still have a few more points to make, however I have had little time this week. I agree organizing the info /articles/research is quite a painstaking process, even more so trying to "articulate" the info. So please forgive me for this brief post……as this week I am unusually pressed for time…….
Markets are not efficient, rather they are effective - Jones
 
1
  • Post #1,297
  • Quote
  • Edited 4:30pm Jan 11, 2018 3:43pm | Edited 4:30pm
  •  nealpek
  • Joined Feb 2011 | Status: Member | 1,405 Posts
Hello mzvega, very impressive thread. I must have missed this small detail, but as you are trading spot as opposed to futures(correct me if I'm wrong), can you tell me which start time you are using for the daily profiles? As I am in EST, would you start your profile at the 5:15pm early evening open, midnight, or 8am or 9:30am, both considered NY opens to some degree? Or does it really matter? My trading style is actually quite similar to yours, TPO counts in conjunction with the bigger composites, as well as particular attention to the "minus" or vertical movements. In addition, I incorporate the use of wrb hidden gaps in my analysis and it has proved time and again to aid in getting the direction correct BEFORE the larger vertical or "minus" move occurs. I know your mastery of amvt does not allow for any outside variables, but as you were so kind to share your knowledge base with the community, perhaps my small contribution could be an addition to your arsenal. Most of the people on these boards don't have a clue about true market flow and the underlying mechanics that drive them. Quite refreshing to hit on the odd trader who truly understands the real dynamics behind the data.
Thanks in advance, I have thoroughly enjoyed reading this thread!
 
 
  • Post #1,298
  • Quote
  • Jan 11, 2018 5:04pm Jan 11, 2018 5:04pm
  •  mzvega
  • Joined May 2009 | Status: Member | 1,879 Posts
Quoting nealpek
Disliked
Hello mzvega, very impressive thread. I must have missed this small detail, but as you are trading spot as opposed to futures(correct me if I'm wrong), can you tell me which start time you are using for the daily profiles? As I am in EST, would you start your profile at the 5:15pm early evening open, midnight, or 8am or 9:30am, both considered NY opens to some degree? Or does it really matter? My trading style is actually quite similar to yours, TPO counts in conjunction with the bigger composites, as well as particular attention to the "minus"...
Ignored
I don't use daily profiles......
Markets are not efficient, rather they are effective - Jones
 
 
  • Post #1,299
  • Quote
  • Jan 11, 2018 10:18pm Jan 11, 2018 10:18pm
  •  nealpek
  • Joined Feb 2011 | Status: Member | 1,405 Posts
My apologies, I meant what time of day in your 3 day profile do you start from?
 
 
  • Post #1,300
  • Quote
  • Edited Jan 12, 2018 1:45am Jan 11, 2018 10:29pm | Edited Jan 12, 2018 1:45am
  •  mzvega
  • Joined May 2009 | Status: Member | 1,879 Posts
Quoting nealpek
Disliked
My apologies, I meant what time of day in your 3 day profile do you start from?
Ignored
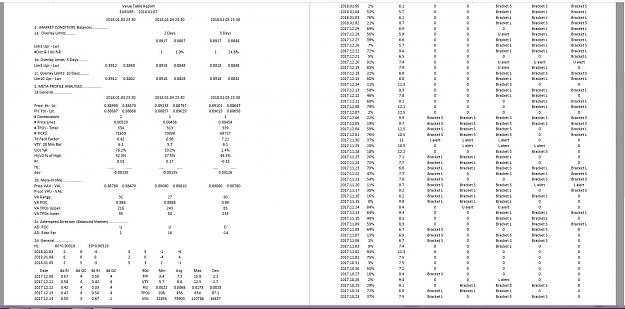
Again you are implying I trade 3 day profiles, I don't trade the "profiles" that is a MP concept. I make trading decisions using a three day sample of data.
0:00 utc/gmt
Markets are not efficient, rather they are effective - Jones
 
 
  • Trading Discussion
  • /
  • Auction Market Value Theory & Analytics
  • Reply to Thread
    • 1 6364Page 656667 81
    • 1 64Page 6566 81
0 traders viewing now
  • More
Top of Page
  • Facebook
  • Twitter
About FF
  • Mission
  • Products
  • User Guide
  • Media Kit
  • Blog
  • Contact
FF Products
  • Forums
  • Trades
  • Calendar
  • News
  • Market
  • Brokers
  • Trade Explorer
FF Website
  • Homepage
  • Search
  • Members
  • Report a Bug
Follow FF
  • Facebook
  • Twitter

FF Sister Sites:

  • Metals Mine
  • Energy EXCH
  • Crypto Craft

Forex Factory® is a brand of Fair Economy, Inc.

Terms of Service / ©2023