Everyone who has Mouteki GBPUSD short orders open, be careful with your short positions targeting the 1.8900 area. There's a lot of support there. I'm not saying it can't go down below this region, take precautions just in case. My first Mouteki target of 85 pips hit. Targeting the second at 1.8910.
It looks like it's on it's way there as I write, testing 1.8930 now.
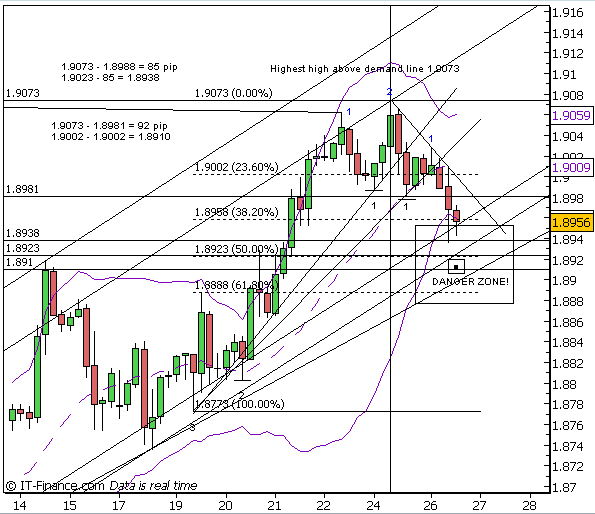
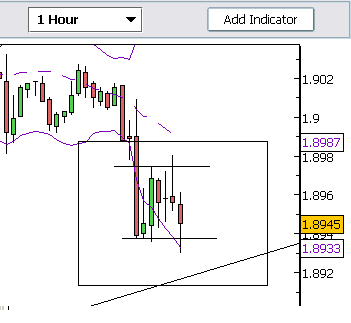
The GBPUSD did dip down to 1.8930 when long at 1.8960 and my target TP was at 1.8910. But I rather closed the trade at 1.8944 ( some deviation from mouteki ) due to the price is fall under zone D ( under my definition ) which can only give small profit once only. The price will likely heading back to the intersection trend at 1.9025 before make a big fall to the south again.
I hope my judegement is correct and anyway I have my 19pips profit in advance.
So far the most profitable pairs using mouteki strategy are GBPUSD, USDCHF, USDCAD. As for JPY pairs, 10 trades with only one trade profitable. So I can avoid to trade any pairs relate to JPY until I can recognise their pattern movement.
In addition to the previous post, demand and supply trends form a good indication of the price movement.<o></o>
<o></o>
When demand and supply trends cross, different scenarios can be viewed as follow:<o></o>
<o></o>
Zone A : price is at this zone is consolidation stage where ranging do happen. If the price between two trends are quite far apart, then price ranging can occur many times until the trend price differences narrow down to less than 50 pips take as an example. The trends are not fixed as they will adjust by the trader on every H4. The slope of the trend also determines the price movement, the higher anger of the slope toward vertical line the better chances of the price direction confirmation once its break the trend. The trend with close to horizontal line is either oversold/overbought for supply/demand trend, hence any break through on the opposite trend line or price escalating toward the opposite trend will likely have big projected profit. A good example to EURUSD happen on 25<sup>th</sup> Sep.
<o></o>
Zone B: Price at this zone is when price above both trends. The price is likely to reach the projected profit on the long trade. A new trend pattern can change the situation quickly within a day, so it is good to have one good long trade only but no swing trade. AUDUSD is another example happen on 25<sup>th</sup> Sep.
<o></o>
Zone C: Price in this zone is the most noisy zone as there is no clear direction of the price until a new set of trend is formed. It is also good to know such zone so that its about time to relax and wait for the clearer picture.
<o></o>
Zone D: The opposite of Zone B where short trade is recommended. EURJPY is another example on 25tth Sep. Somehow for zone B and D, the wider anger on both trend, the lesser project profit for which I can’t explain to it.
<o></o>
For any chart where there is only one trend which may signal the price is in swing direction in accordance to the trend direction. But it is also good to catch the profit along the ranging direction.
<o></o>
For any currency pairs relate to JPY, the pattern and trend is more uncertain due to too much noise interruption, hence I will not try to trade any one of them if possible.
<o></o>
Finally the above explanation is my own observation which does not base on any scientific research or mathematic theory but purely using Mouteki strategy and other indicator to form the conclusion. You can use it on the backtest or forward test where you can feel the direction of the trend. I will not reply any comment on how I derive it or how I come to such conclusion.<o></o>
Ignored
I found your observations regarding the 4 Zones to be very interesting. I've been trading full time now for about a year, and I added Mouteki system to my strategy. I also noticed there are peculiarities in these zones, just didn't know how to describe it. Anyways, I copied it in a separate document for future reference.
I share your view on JPY pairs. I use mouteki strategy for trading and it work most of the time except TP may not hit all the time. So I use the zone method as I mentioned in post 1409 to decide how to exit by looking at the price movement. I may be wrong to miss some additional profit but at least I am still make profit with less fail trades.
In addition to the previous post, demand and supply trends form a good indication of the price movement.<?xml:namespace prefix = o ns = "urn:schemas-microsoft-com:office:office" /><o></o>
<o></o>
When demand and supply trends cross, different scenarios can be viewed as follow:<o></o>
<o></o>
Zone A : price is at this zone is consolidation stage where ranging do happen. If the price between two trends are quite far apart, then price ranging can occur many times until the trend price differences narrow down to less than 50 pips take as an example. The trends are not fixed as they will adjust by the trader on every H4. The slope of the trend also determines the price movement, the higher anger of the slope toward vertical line the better chances of the price direction confirmation once its break the trend. The trend with close to horizontal line is either oversold/overbought for supply/demand trend, hence any break through on the opposite trend line or price escalating toward the opposite trend will likely have big projected profit. A good example to EURUSD happen on 25<SUP>th</SUP> Sep.
<o></o>
Zone B: Price at this zone is when price above both trends. The price is likely to reach the projected profit on the long trade. A new trend pattern can change the situation quickly within a day, so it is good to have one good long trade only but no swing trade. AUDUSD is another example happen on 25<SUP>th</SUP> Sep.
<o></o>
Zone C: Price in this zone is the most noisy zone as there is no clear direction of the price until a new set of trend is formed. It is also good to know such zone so that its about time to relax and wait for the clearer picture.
<o></o>
Zone D: The opposite of Zone B where short trade is recommended. EURJPY is another example on 25tth Sep. Somehow for zone B and D, the wider anger on both trend, the lesser project profit for which I can’t explain to it.
<o></o>
For any chart where there is only one trend which may signal the price is in swing direction in accordance to the trend direction. But it is also good to catch the profit along the ranging direction.
<o></o>
For any currency pairs relate to JPY, the pattern and trend is more uncertain due to too much noise interruption, hence I will not try to trade any one of them if possible.
<o></o>
Finally the above explanation is my own observation which does not base on any scientific research or mathematic theory but purely using Mouteki strategy and other indicator to form the conclusion. You can use it on the backtest or forward test where you can feel the direction of the trend. I will not reply any comment on how I derive it or how I come to such conclusion.<o></o>
Ignored
Hello DivneFund,
You can't just come to conclusions and not explain why. Atleast not in a public forum.
Please refer to my last paragraph where I clearly stated it is my own observation on many charts when dealing with trend in intersection situation where how the price is moving. Hence I will not explain it further but you can practice it or trade it when you see such situation, then you can understand what I mean.
I am doing very well with a USD/JPY trade I took today..it just required some patience. Note..avoid GBP/JPY as it really does have a mind of its own..EUR/JPY and USD/JPY seem to work ok though.
The GBPUSD did dip down to 1.8930 when long at 1.8960 and my target TP was at 1.8910. But I rather closed the trade at 1.8944 ( some deviation from mouteki ) due to the price is fall under zone D ( under my definition ) which can only give small profit once only. The price will likely heading back to the intersection trend at 1.9025 before make a big fall to the south again.
I hope my judegement is correct and anyway I have my 19pips profit in advance.
Ignored
Absolutely nothing wrong with 19 Pips! Mouteki is a good system I agree. I deviate from it also. I use it as reinforcement for my current system. I still use fibonacci for price projection in conjuction with Mouteki. I've noticed that the Mouteki lines compliment the other trend lines. I particularly like using "divergence" with the stokes as well.
As mentioned before, profit on zone D is small and the price will move back toward the intersectional trend but slowly. If it takes more than 2 H4 to do it, then a new trend lines are form and forcing the price to fall into zone A which may heading south again due to the previous supply trend near horizontal line ( that is overbought or resistance level ).
look at USD/YEN....
was it break with mouteki trading?
but i am effraid to trade in, ....
i am just trade in GBP USD with maouteki..
nice with mouteki.....
thanks all...
thanks mouteki..
Sat down and read Mouteki's documentation and I am quite impressed. I am new to forex trading but have been a technical stock trader and found that significant trendline breaks present the best opportunities. I too find indicators worthless for the most part. I drew this trendline last night on 9-26-2006 at around 10pm EST just after reading the Mouteki's documentation. At the time the lower support line looked like it may break. When I woke up this morning at around 6am it did break with the first candle below the line to open at 1.2712. I got in at about 1.2698 and I am up as I write this 20 or so pips. Based on Mouteki's methodology I am looking for a target of 1.2585 on the downside. Anyone else get this too?
I have found that most times after a break of support the price will usually come up and test the breakdown point. The highest probability is usually a test and failure. It is not uncommon for the price to temporarily go above the trendline and then fail shortly after. The guys at elliottwave.com call it a "kiss goodbye" and then the price falls in earnest. I would keep a stop on a 240 min candle close above the former support line (now resistance). You should see candles with overhead long shadows below but never a solid close above teh trendline.
What I did this morning was take a small position on the break and will add on a failure at the breakdown point - if that occurs. If not, I will ride my existing position to the target.
Well EURUSD is in zone D but its supply trend has better slope than GBPUSD. Hence it can gain better profit than GBP but only once only in zone D. Observe both GBPUSD and EURUSD, the price is bouncing back so a new demand trend will happen on the next 8 hours. This also force the price fall in zone A and the price will move north in swing mode until the breaking of trend line is occurred.