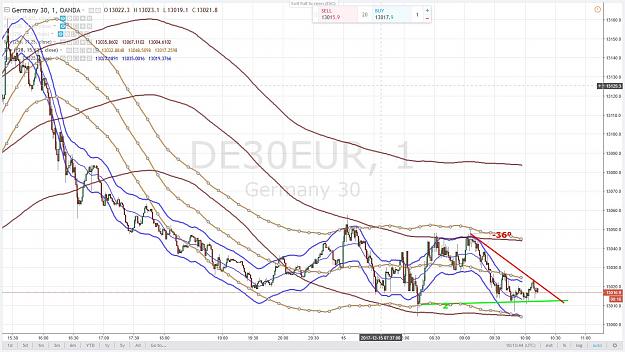
Could you briefly explain what this chart is supposed to suggest?
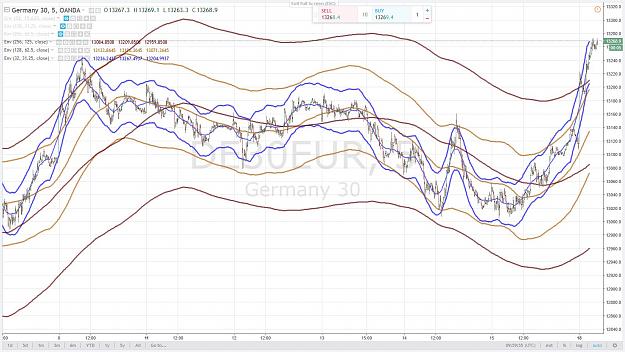
To me, the depicted situation is one where a 1 minute chart does not suffice on its own, but where a 5 minute chart is more relevant for trade planning.
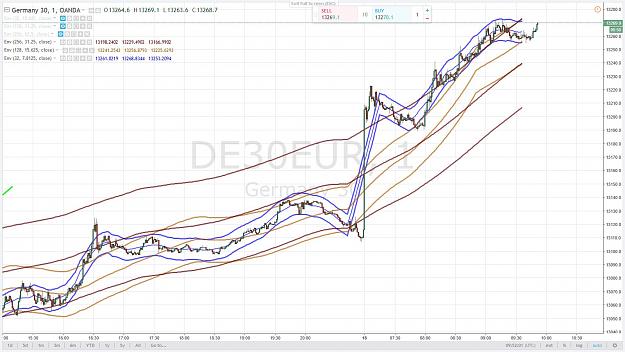
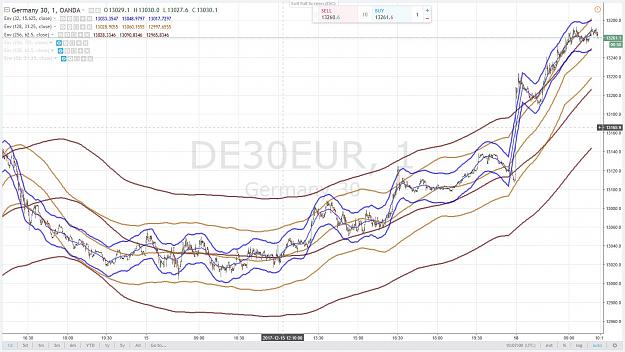
And in general I find the 1 minute chart less useful for execution, so for me the way to go is 5 minute chart for creating a plan, and a faster chart for entry - and then the faster chart need not necessarily be equipped with the three channels, as one is effectively trading off the 5 minute chart.
Thoughts on that?