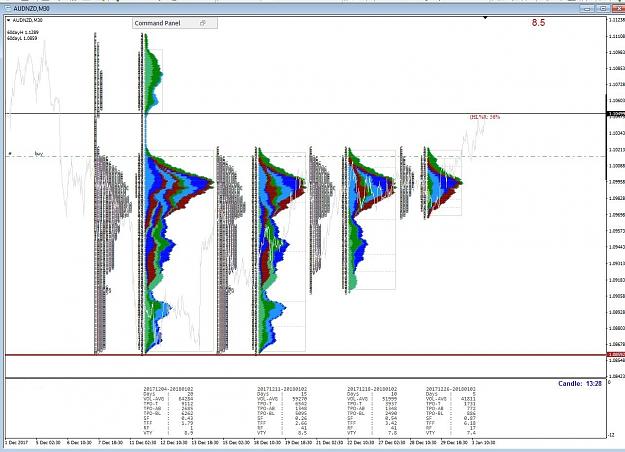
DislikedHello @mzvega @evak Are you aware of any Indicator which is close to TPOChart2.1 for Ninjatrader where one can export data to spreadsheet? Thanks. Edit: searched a lot for AMVT related indicator for Ninja but could not find it & unfortunately MT4 doesnt work in markets I trade in.Ignored
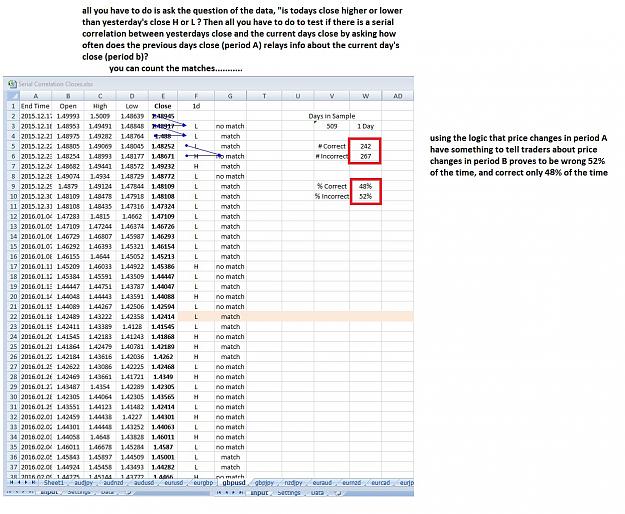
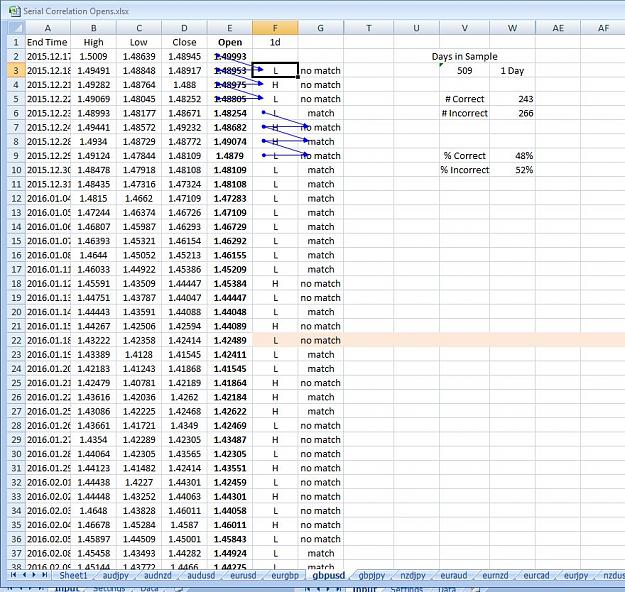
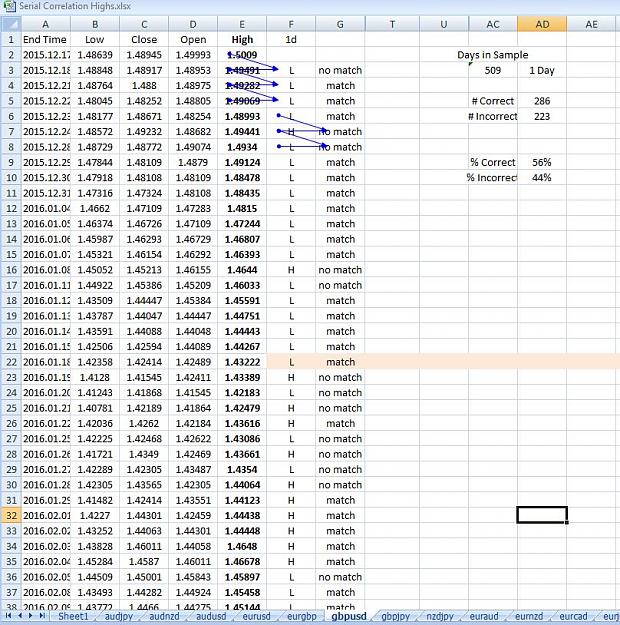
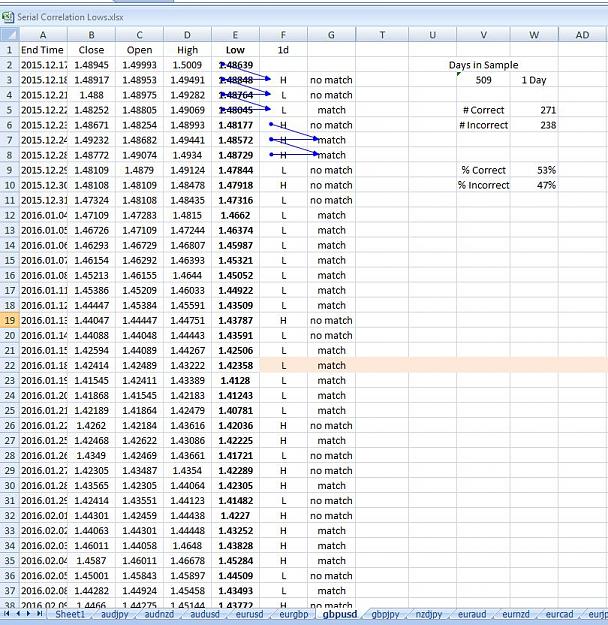
I do this so my "analysis" is not dependent on any one charting package or any particular indicator.
https://www.forexfactory.com/showthr...25#post9341025
Sorry I could not be of any help……
Markets are not efficient, rather they are effective - Jones