{quote} dude, no offense, but you ever look at any bearish set ups?
Ignored
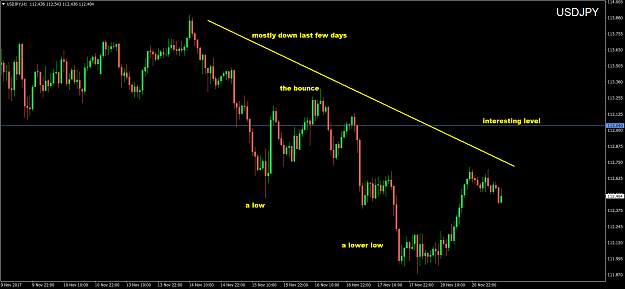
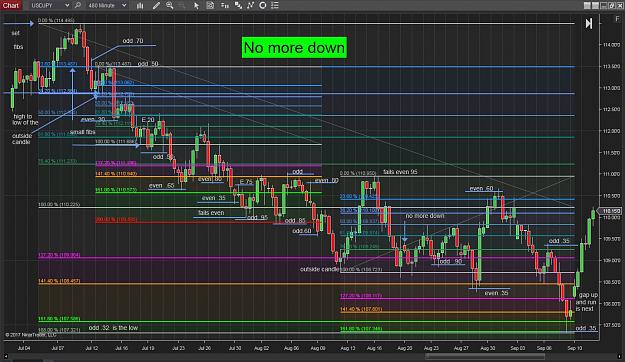
LOL, yes I do when the bear's are in town. should have been last week, I've been here and done this a few times. last week was the hardest part for me. hopefully next time i will do better. i can only remember once i got it perfect. still knocking off the rust. and rebuilding my maps. I just can not ignore this. there is a reason i took the pain last week. it was not just for fun.
{quote} LOL, yes I do when the bear's are in town. should have been last week, I've been here and done this a few times. last week was the hardest part for me. hopefully next time i will do better. i can only remember once i got it perfect. still knocking off the rust. and rebuilding my maps. I just can not ignore this. there is a reason i took the pain last week. it was not just for fun. {image}
Ignored
well I'll be honest with you, I have zero experience with bats, crabs, or the like..but it seems to be that there is always one about, and/or they are getting redrawn frequently....not suggesting that they don't work, but personally, I wouldn't spend 5 mins looking at them...
Joined Aug 2009
|
Status: Ride the Pig
|31,271 Posts
its all crap really, in the end....and there is no secret to this thing, but for me, the two things that matter, or at least make this bearable....is get a decent payout when you risk your money....and trade less...
I'd say it applies to all methods of tea leave reading...
{quote} well I'll be honest with you, I have zero experience with bats, crabs, or the like..but it seems to be that there is always one about, and/or they are getting redrawn frequently....not suggesting that they don't work, but personally, I wouldn't spend 5 mins looking at them...
Ignored
They are not my primary strategy, only when they work. I do agree that most straggles that are solely based on them are buggy at best. this one just happens to be here and works. I didn't even know it was until another trader on this thread pointed it out. years ago, one trader said it was a gartley the other said it was a head and shoulders. i see the gartley others see it differently.
{quote} They are not my primary strategy, only when they work. I do agree that most straggles that are solely based on them are buggy at best. this one just happens to be here and works. I didn't even know it was until another trader on this thread pointed it out. years ago, one trader said it was a gartley the other said it was a head and shoulders. i see the gartley others see it differently.
Ignored
who the fuck is this Gartley guy anyway...
so what is your primary strategy....
mine is guessing where the market turns based on levels I pick off a chart, basically...
{quote} who the fuck is this Gartley guy anyway... so what is your primary strategy.... mine is guessing where the market turns based on levels I pick off a chart, basically...
Ignored
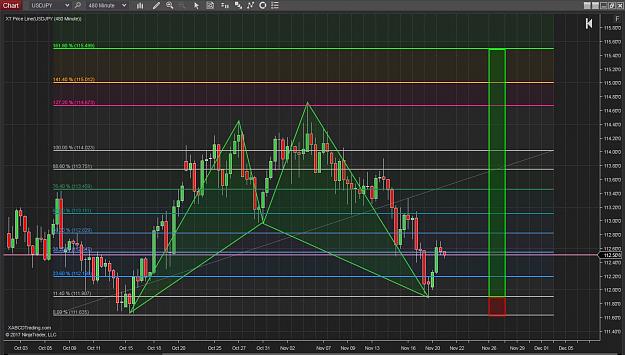
Gartley is the name of that pattern if im not mistaken.
My strategy is trading the repeating pattern that the market plays out over and over and over. its just ridiculously long. and we are in a large version of it.
70-80% at best of trend movements with oscillators, and moving averages, thats why more experienced traders tend to use them as conformation. and use fibs and price action for more accurate entry's and exits. price action, thats the one. the conundrum, i could not swallow was that if pa is solely based on buyers and sellers. no pattern should ever repeat itself. we humans are creatures of habit until money is involved then we are the most inconsistent creature there is, with emotions and what not. so then why do patterns perfectly repeat them self? we teach ourselfs to become as robotic as possible, and read things inversely and most importantly wait until we see it, why cant a pattern simply repeat itself is a reduculsy long fation. i could put up a bunch of images but i think It would be a wast if time.
{quote} Gartley is the name of that pattern if im not mistaken. My strategy is trading the repeating pattern that the market plays out over and over and over. its just ridiculously long. and we are in a large version of it. 70-80% at best of trend movements with oscillators, and moving averages, thats why more experienced traders tend to use them as conformation. and use fibs and price action for more accurate entry's and exits. price action, thats the one. the conundrum, i could not swallow was that if pa is solely based on buyers and sellers....
Ignored
I guess things repeat, sure, and we do tend to see what we want. That's why I say its all crap. All I know is that when I was on the floor, we didn't have any charts at the ready. Sure we looked at them before the day started, and some guys ran out the pit, or had someone bring them one. And yes, guys used pivots, and we talked about moving averages, and RSI, and recent highs and lows, and Fibs and everything else. But looking back, two things stand out to me. One, when things got busy, we traded the flow, you couldn't do otherwise really. The second thing, was we always looked to get in a position with the lowest risk. I lost those two concepts I think after I left the floor.
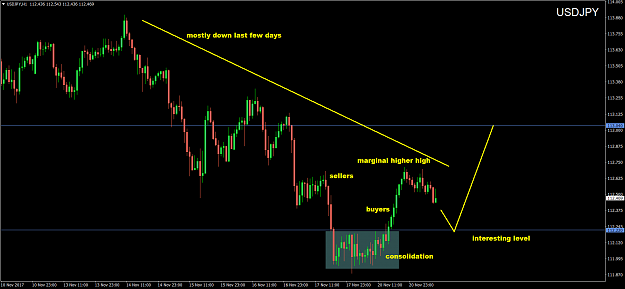
and here is my read for 112.22, but that HH is really marginal... {image}
Ignored
I kind of like this, but I think price action to down was a fakeout. If you look at 4h, 1h, looks like reverse h&s is now complete and should head higher.
{quote} I kind of like this, but I think price action to down was a fakeout. If you look at 4h, 1h, looks like reverse h&s is now complete and should head higher. I think London open likely to decide.
Ignored
that level will look better if we move a little higher I think...well see what develops...
{quote} I guess things repeat, sure, and we do tend to see what we want. That's why I say its all crap. All I know is that when I was on the floor, we didn't have any charts at the ready. Sure we looked at them before the day started, and some guys ran out the pit, or had someone bring them one. And yes, guys used pivots, and we talked about moving averages, and RSI, and recent highs and lows, and Fibs and everything else. But looking back, two things stand out to me. One, when things got busy, we traded the flow, you couldn't do otherwise really....
Ignored
Thank you, that is the basis of my strategy, lowest risk, with the flow. and yes everything they provide us is b.s. most people dont understand the confilct of interest. that is created by them taking the other side of our trades. they are not your friend. the sob's are quite nice when you give them money to deposit in our accounts. then they emedetly implement the 90/90/90 phenomenon. that many percent of traders loose that much of their equity in that time frame. you are the first to get it.
{quote} I kind of like this, but I think price action to down was a fakeout. If you look at 4h, 1h, looks like reverse h&s is now complete and should head higher. I think London open likely to decide.
Ignored
Yea, that's kinda where my head is at too. I had a short position open from 112.6 but I had to close it, now we're right at the point where we should be either confirming or invalidating that H&S. If it reacts higher, I would love to get short around 113, I still think we're in an overall downtrend.
there is no inverted H*S in USDJPY. period. The primary direction is south, so we will hit 111.70 soon. upside capped @ 112.70. Stop making things up.
Ignored
Dude relax... This is a place for discussion, your dissenting opinion is welcome and even valued but don't talk down to people who think something else, even if you're right. what is the point of that?