Oh come on now. Nobody cares how many magic calls you made - I can send you a whole 200MB PDF that shows clearly I'm fucking Gandalf and can not only predict but make the future. I can not only remember the high in cable, I can also remember the not quite high of e/u in 2008 @ 1.50 where I thought it couldn't go much further. Guess what, I was right, if you define the boundary conditions for "right" accordingly.
All of this is completely irrelevant and useless.
If you can't or won't explain your process, I just don't care.
You can't create a game with positive expectancy on random data. Working with that idea in mind, I suddenly found myself with a lot less work to do.........where does market data deviate from random data? Is it possible to define price points that show a better-than-random propensity to become turning points?
Ignored
FWIW I see things very similarly to you. I posted a list of some non-random phenomena in myth #22 here. As this is a public forum, I don't want to give the game away, but I've satisfied myself that a few of these, combined with some basic FA, can give one a very solid starting point. It's a case of finding potentially overriding reasons for bias, and then using key zones and flows to fine tune your timing.
{quote} Yes. And how would they look like if you started them 1 minute / 17 minutes / 3.5 hours ago or last Thursday? Different. This is one of the low hanging fruit and huge timesavers you can take away from this thread: candlesticks don't mean shit.
Ignored
Yes you need to combine candlesticks with price action, but price action without candlesticks isnt shit either.
posting a chart with an entry point would n't take more than 1 minute, & the OP could have saved all these talks arguments & "wastage of time" of unfortunate Forex-factory folks who don't have a "3rd eye".
Not all edges are trade-able, let alone profitably. Its like saying, there's a 100% guaranty there will be 24 candles in the hourly chart by the end of today.
Either he thinks himself bestowed with "alien-ish knowledge" or his strategy "a digital ATM-box".
The OP wants to help people by making them waste their time reading 91 pages!
{quote} FWIW I see things very similarly to you. I posted a list of some non-random phenomena in myth #22 here. As this is a public forum, I don't want to give the game away, but I've satisfied myself that a few of these, combined with some basic FA, can give one a very solid starting point. It's a case of finding potentially overriding reasons for bias, and then using key zones and flows to fine tune your timing.
Ignored
Exactly, that's how this game is played to win, "potentially overriding reasons for bias" is a necessary safe practice to trade within limited risk.
In reality, "randomness" is a euphemism for either a lack of information; or a lack of knowledge about what information is available, and how to use it profitably.
Ignored
Have been saying all along it all boils down to lack of knowledge, it might sound offensive but that's the reality. No trader will open short trades if they knew beforehand the market will go up a 100pips, right.
posting a chart with an entry point would n't take more than 1 minute, & the OP [and CP] could have saved all these talks arguments & "wastage of time" of unfortunate Forex-factory folks who don't have a "3rd eye". Not all edges are trade-able, let alone profitably. Its like saying, there's a 100% guaranty there will be 24 candles in the hourly chart by the end of today. Either he thinks himself bestowed with "alien-ish knowledge" or his strategy "a digital ATM-box". The OP wants to help people by making them waste their time reading 91 pages! That's really...
{quote} Oh come on now. Nobody cares how many magic calls you made - I can send you a whole 200MB PDF that shows clearly I'm fucking Gandalf and can not only predict but make the future. I can not only remember the high in cable, I can also remember the not quite high of e/u in 2008 @ 1.50 where I thought it couldn't go much further. Guess what, I was right, if you define the boundary conditions for "right" accordingly. All of this is completely irrelevant and useless. If you can't or won't explain your process, I just don't care.
Ignored
love you
don't predict direction, but dance with flow of water
The problem is, even if you find a non-random pattern, it would be hard if not impossible to exploit it. The market may not be 100% efficient, but it is very efficient. Any price discrepancies would be quickly targeted by arbitrageurs working for banks or hedge funds - the general trading public would jump in way too late.
I posted a list of some non-random phenomena in myth #22 here.
Ignored
I sure wish I read that whole post, and not only #22, before I started digging on my own... but maybe I wouldn't have been able to really appreciate it. Awesome post, kudos.
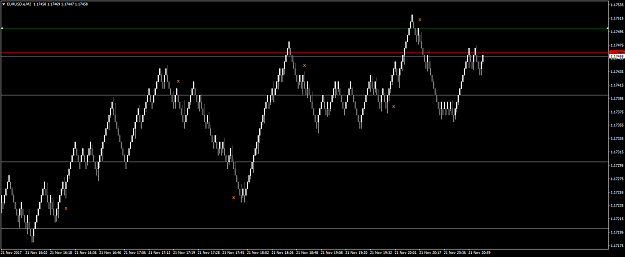
Inconclusive: the x-axis seems to be not really important.
Attached Image (click to enlarge)
It's 10 pips between the grey lines, plenty enough to make some $ even considering spread, comm, special broker features. When I grow up, I want to be able to do this on a 20 pip renko...
{quote} If you say that a bunch of numbers need to carry information before it can be called "data", point taken.
Ignored
it is not on retail trader to classify data as random. market makers interpret data as per their wish since they can move price and retail trader cannot. market makers decide when and how to trade available information....and so on....by now you should understand that and accept it.
NO MATTER THE SITUATION,NEVER LET YOUR EMOTIONS OVERPOWER YOUR INTELLIGENCE
I sure wish I read that whole post, and not only #22, before I started digging on my own... but maybe I wouldn't have been able to really appreciate it.
Ignored
Thanks. You might enjoy the videos of Tom Dante (if you haven't already discovered him). He's a successful ex-prop trader who tends think along some similar, no-nonsense lines. (He's also a very colorful character, so expect some bad language!!)
Inconclusive: the x-axis seems to be not really important. {image} It's 10 pips between the grey lines, plenty enough to make some $ even considering spread, comm, special broker features. When I grow up, I want to be able to do this on a 20 pip renko...
market makers interpret data as per their wish since they can move price and retail trader cannot. market makers decide when and how to trade available information
Ignored
Yes. Maybe. Or not. I don't work in this industry, I have no inside knowledge about anything. I can tell when a number series starts to deviate from what you would expect from random data, that's all. And that's definitely not my own invention, I wish I were smart enough to cook up something like that
Honestly I have no idea what the market makers in an OTC crapshot funfair market like FX can or can't do. You tell me. In the end, it doesn't make any difference who or what drives price and why. Compare EURUSD from the day before yesterday, yesterday and today. Combine all the info you have and decide when and where you want to bet small, bet big, bet not at all.
{quote}Thanks. You might enjoy the videos of Tom Dante (if you haven't already discovered him). He's a successful ex-prop trader who tends think along some similar, no-nonsense lines. (He's also a very colorful character, so expect some bad language!!)
Ignored
Yes I already watched everything from Tom he ever put on Youtube, love that guy! And his bad language, it's nearly as bad as mine
It's a renko chart. Without the time component, you don't get "signals" on a chart that just chops back and forth anymore, but you also lose the idea of how far / how fast if you can't watch it all the time, because the time component is missing. It's a trade-off really. I condensed everything I learned from this thread and others into the x signs. It's pretty much impossible to lose money following them, even spread and comm included. Edit: now I just need to figure out how to not break even, but actually end up with a "+" with them.
BTW, today's E/U is a nice example why you shouldn't short from the daily high. Imagine the pain.