It seems better on the daily middle band and 4hr upper/lower band when there is already strong setup on the daily. Same applies on weekly middle band and daily upper/lower band. When there is strong setup on the weekly, using the weekly middle band and daily upper/lower band works well and allows one to get in earlier
Make all mistakes in demo and rain in pips in live account
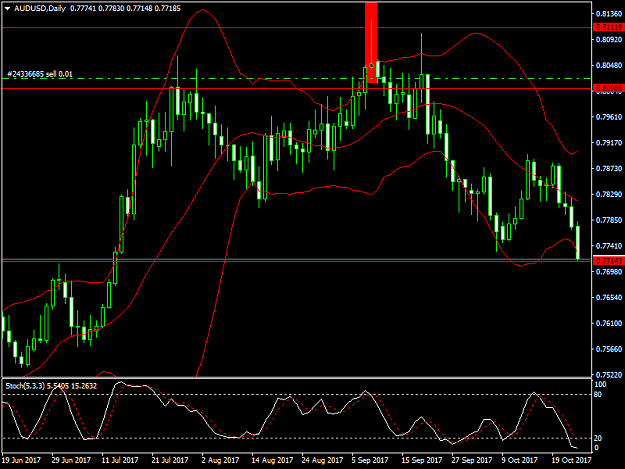
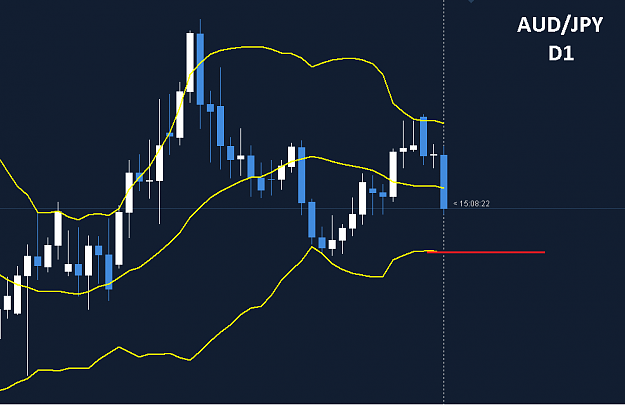
Are the following pairs ready to crash now, AUDUSD, AUDJPY and AUDCHF. There had been great setup on the daily. The're making daily middle band and 4hr lower band strategy setup
Make all mistakes in demo and rain in pips in live account
If you ready some of the earlier post this had been dealt with. When using the weekly middle band and the daily upper band for bullish trade your sl is safer having the sl below the low price of the weekly bullish candle the combined to make the setup. For short trade, the sl should be above the high price of the bearish candle that combined to make the setup. Similarly when using the daily middle band and 4hr upper band for bullish trade the sl is safer when it's below the low price of the daily bullish candle. What I mean generally is that the longer TF candle should be used for sl. I have said in the past post and wish to repeat that when the sl size is too wide for your account, you either reduce the lot size significantly or skip it
Make all mistakes in demo and rain in pips in live account
Sometime ago I shared some of the strategy I have found to be working well, I still receive loss sometimes. Here is one them, "Gravestone Doji" below resistance or on sideways. It was formed below broken support, 0.80977, now acting as strong resistance
Attached Image (click to enlarge)
Make all mistakes in demo and rain in pips in live account
S/R levels are the major points I wait for setup.s Sometimes when the candlestick patterns are formed we should check whether there were formed on support ( for long trade ) or below resistance ( for short trade )
Make all mistakes in demo and rain in pips in live account
The long awaited EURAUD long movement. It's closing above the upper band. I already knew that the bearish movement could be fake. This is because of the AUDCHF strong short trade setup already formed. As you may have already known the are negatively correlated because of the strong correlation of EURO and CHF. When AUDCHF formed strong bearish setup the EURAUD would finally form bullish trade setup and vice versa
Make all mistakes in demo and rain in pips in live account
If you can remember, I said sometime ago that EURGBP correlated pair, GBPCHF formed bullish engulfing above Fibonacci level 38.2%. Today's candle still formed above it and also strongly rejected the lower band by forming strong hammer, having "Bullish Body". Having bullish body indicates that it has strong probability/momentum to fly. I might be wrong, but market is always right.
Ignored
Wow, GBPCHF had gone positively crazy. Here was the GBPCHF analyses. We can see what hammer with bullish body can do. Happy trading
Make all mistakes in demo and rain in pips in live account
AUD/JPY and AUD/CHF does not break bottom line BB.Maybe I misunderstood the strategy? {image}
Ignored
I did not see the post on time. Get this strategy clear before using it. We work with two different time frames. The chart you posted was daily which was closing below the middle band. Then switch to the immediate shorter time frame, 4hr lower band. When using the weekly and the daily, weekly middle band and daily lower/upper band. That's the long TF middle band and shorter TF lower/upper band. If you're still not clear let me know
Make all mistakes in demo and rain in pips in live account
{quote} Your post informed me to check what USDCAD monthly was doing. I found out that it has already formed strong bullish setup a month ago, strong Dragonfly/Pin bar. It was formed on strong support,1.24626. Getting in on the shorter TF is the game plan now. Thanks for your post {image}
Ignored
USDCAD on the run. Catch it while still fresh
Make all mistakes in demo and rain in pips in live account
Some trade setups for the week AUDCAD: Strong hammer, having bullish body right below the upper band NZDCAD: Dragonfly/Pin/bar above support level, 0.8723, not broken since 31st 2016. As you nay have already known NZDCAD and AUDCAD are strongly correlated because of the correlation of AUD and NZD. GBPCHF: Strong bullish engulfing right above the Fibonacci level I earlier pointed out, 23.6%. On 12th October I said a strong hammer was formed on the level. It retraced and formed bearish engulfing, another setup above the level. EURCAD: Similar to AUDCAD...
Ignored
EURCAD had gone wild.
Make all mistakes in demo and rain in pips in live account