If you are tracking the EURJPY this week, you may consider the following technical perspective.
On the daily time frame, price action has broken the support trendline (navy colour) from the low of April 14, 2017. Together with a resistance trendline (chocolate colour) from the high of July 11, 2017, it was apparent that price action has been operating in a wedge for quite a while. Although the wedge is apparently breached southward, a support trendline (magenta colour) from the highs formed between July and early September 2017 is still intact and will have to be breached before we can expect momentum for a bearish continuation. Should this happen, a likely target for such a bearish move is the 129.970 area, the origin of the most recent swing high. Otherwise, we may expect price action to move sideways for a while or retest the 133.800 area.
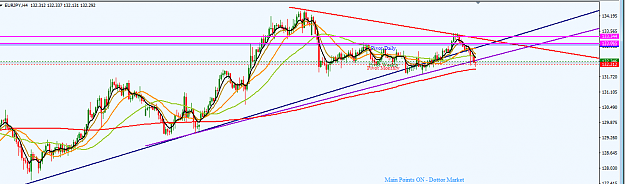
Price action was operating in a wedge on the H4 time frame for a long while in September and October. The wedge is not yet broken, particularly considering that the wedge support (dark violet colour) on the H4 time frame is still not decisively breached even though that of the D1 time frame (navy colour) has been breached. Therefore, we may expect a retracement, perhaps to retest the wedge resistance (red colour); although the support trendline on D1 turned resistance may be an initial target of such a retest. We may expect the 133.100/350 area to be a magnet of such a retracement before a turnaround for a bearish continuation materializes. The technicals on the H4 time frame are disposed southward.
I may be wrong. Trade safe and prosper.
KP
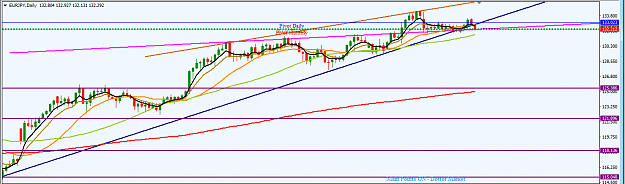
On the daily time frame, price action has broken the support trendline (navy colour) from the low of April 14, 2017. Together with a resistance trendline (chocolate colour) from the high of July 11, 2017, it was apparent that price action has been operating in a wedge for quite a while. Although the wedge is apparently breached southward, a support trendline (magenta colour) from the highs formed between July and early September 2017 is still intact and will have to be breached before we can expect momentum for a bearish continuation. Should this happen, a likely target for such a bearish move is the 129.970 area, the origin of the most recent swing high. Otherwise, we may expect price action to move sideways for a while or retest the 133.800 area.
Price action was operating in a wedge on the H4 time frame for a long while in September and October. The wedge is not yet broken, particularly considering that the wedge support (dark violet colour) on the H4 time frame is still not decisively breached even though that of the D1 time frame (navy colour) has been breached. Therefore, we may expect a retracement, perhaps to retest the wedge resistance (red colour); although the support trendline on D1 turned resistance may be an initial target of such a retest. We may expect the 133.100/350 area to be a magnet of such a retracement before a turnaround for a bearish continuation materializes. The technicals on the H4 time frame are disposed southward.
I may be wrong. Trade safe and prosper.
KP
Attached Image (click to enlarge)
Attached Image (click to enlarge)
Do your homework, follow the footprints of smart money