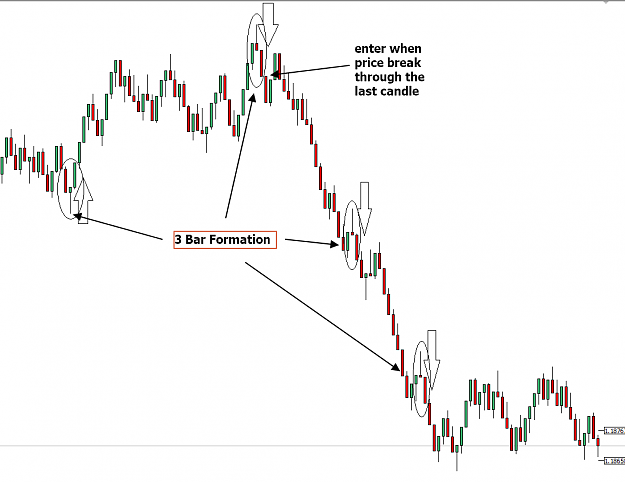
And we should be patient to wait until the formation appear, and price break throuh the last candle in the shown direction.
edit : or simply we enter at the opening price of the next candle after the three bar formation formed.
Looking for higher timeframe candlestick overlay indicator 6 replies
Beating the Odds - Edge Within a Single Candlestick (Explained) 70 replies
An Edge for an Edge (System Development) 113 replies
top 2 single candlestick pattern 7 replies
There is No Edge in a Single Candlestick 64 replies
Disliked{quote} Hello, Havo! What you're showing us are nice ideas for sure, but, speaking about the initial topic of this thread - it's actually not what is meant in the "higher edge in a single candlestick" statement. The reason is simply because you're talking about 3-candle reversal pattern (even though I totally understand what is the logic behind it), while the edge lies withing a single candlestick. I mean when we have only this information and have to trade this current candle (before it's closed): {image} Timeframes don't matter here. It's just...Ignored
Disliked{quote}In other words, the price always moves away from any reference point. And Japanese candlestick/regular bar (single) contains all the information that is needed to use this edge. I suggest everyone who is trully interested in the initial topic to take a look once again at the screenshot that Neio posted here. You don't need anything else to understand the logic behind these ideas. Just watch how the price moves away from reference points (it's an open of H1 candles...Ignored
Disliked{quote} hey artem, since you seems to have discover this edge, how about you go first : if you were to trade that single candle, how would you do it ?Ignored
DislikedTHINK ABOUT THIS VERY CAREFULLY: Since range bars the body its the same in EVERY CANDLE (body + wick if there its any) a rejection its clearly shown.. the stronger the rejection the smaller the body..Ignored
DislikedOHLC are just reference points, take away the boxing of price into candlestick, range bar etc and trying to study price movement along y-axis. Price only moves up and down. Mundane but powerful statement, it changed my approach to markets completelyIgnored
Disliked{quote} Onoji, Could you please illustrate with a chart on how you interpret the price with emphasis on Y-Axis? ThanksIgnored
Disliked{quote} If price move 1pip up buy and hold Newtons First Law: a body stays at rest or uniform motion unless acted upon by a force Until it moves 1pip down Newtons Third Law: action and reaction are equal and opposite making these statements into profitable trading system require a lot of work. (Brain work) Put your mind to work. This can be done from a reference open, high, low, close, moving average etc. Can be anything that works for youIgnored
DislikedThere is no edge in this stupid quote. You can say that silly thing for roulette: 95% of the time you will get either black or red. 5% of the time you will get the zero green. So move on.Ignored
DislikedA stupid quote indeed. 95% of time there will be candlesticks instead of dojis. Comon now !Ignored
DislikedYou can say that silly thing for roulette: 95% of the time you will get either black or red. 5% of the time you will get the zero green. So move on.Ignored
DislikedWhat is an edge? {image} {quote} {quote} An edge is a higher statistical occurrence. I think everyone can agree to this? that an edge is simply a higher statistical occurrence. Or the other edge... is to cheat Is there anyone else who can give me a different definition of an edge? So... 95% price will close above or below the open (price will move away from any reference point). 95% are candlestick 5% are dojis. 50% body 25% wick. 80% are breakouts 20% are inside bar 80% are breakouts 20% are outside bars (outside bars are breaks...Ignored