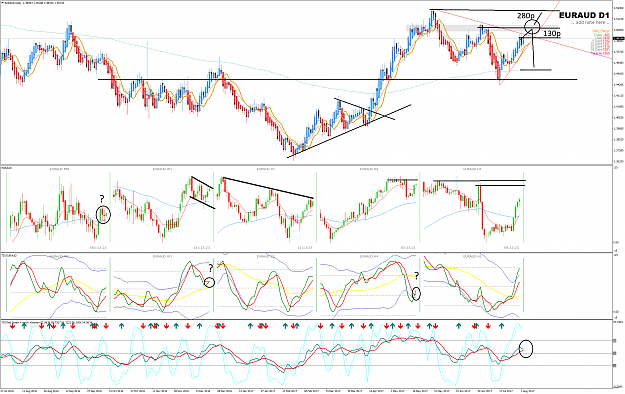
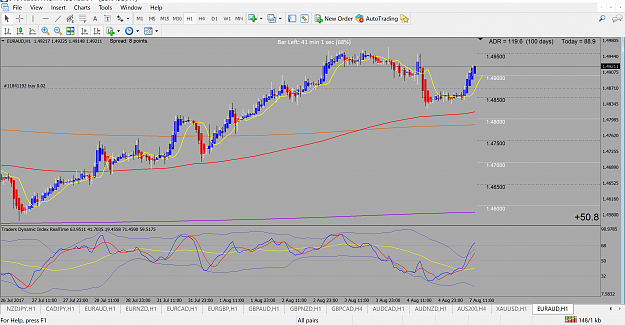
EURAUD on 1 hour chart is indeed looking good. Notice how price action loves the 200 EMA line on the 1 hour chart. This is of course the Day 10 EMA line.
My Buy signal after the TMS cross is the move away from the Red 200 EMA Line ( Daily 10 EMA ) and the Orange 800 EMA Line ( Weekly 10 EMA ).
Using the Power of the 10EMA and you can't go to wrong. I set my trade manage to follow the 1 hour 200EMA Line and add addition trades on any further crosses till the price action crosses the Red Line. Its kind of set and forget but Red news is brutal on the 1 Hour chart.
Attached Image (click to enlarge)
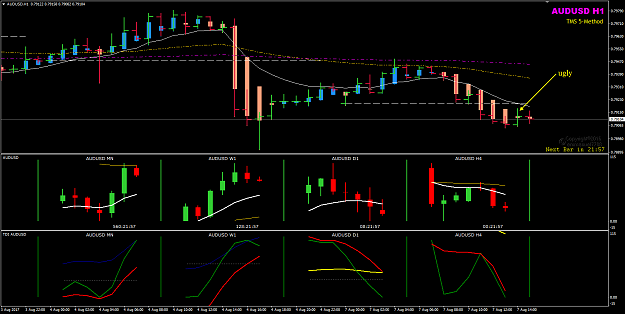
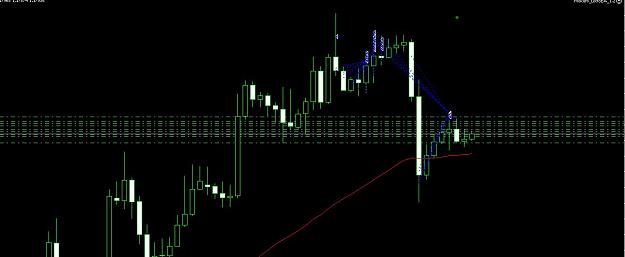
Trading thin liquidity at the boundary of the charts
1