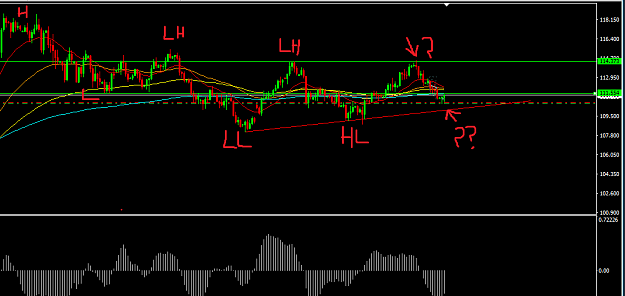
USD/JPY rebounded from 110.60 after all and it formed a spinning top bar on the daily time frame. I don't think that the move to the downside is over in the long term, but for the moment we could see some retracement.
USD/JPY rebounded from 110.60 after all and it formed a spinning top bar on the daily time frame. I don't think that the move to the downside is over in the long term, but for the moment we could see some retracement.
Ignored
i cant agree more. Heading North in the short-run but Still some strength South in the long-run
after the daily candle from yesterday, a close above yesterday high would indicate more likely north... EURO and AUD daily also showing signs of a retrace...
its okay to say you are going with the trend... but its useless if you cant identify SIMPLE indications the trend may change... and let your profits diminish.
the double question mark could be a third higher low... the 2 scenarios are a break of the ascending TL... or a change in the trend... HH up next etc etc..
{quote} I am short Gj 145.45. Risking 30 pips. Should be short UJ as well very very soon.☺
Ignored
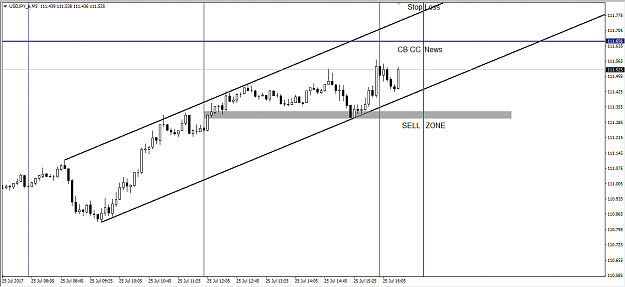
not sure, but I'm thinking of the possibility that tonight news will bring down the price, but by first making long wick upward to touch the weekly central pivot at 111.656.
Naga the grey line is demand zone or buy zone for sake of simplicity. Supply or sell zones are the ones which are from above. Like 111.58 / 111.54 is a good dtrong supply zone on 1 Hr chart. Its already 20 pips down from that zone.
{quote} Naga the grey line is demand zone or buy zone for sake of simplicity. Supply or sell zones are the ones which are from above. Like 111.58 / 111.54 is a good dtrong supply zone on 1 Hr chart. Its already 20 pips down from that zone.
Ignored
you're right, I'll learn to name the object with proper names .
the grey line is demand zone. I'll sell USD if the USD price doesn't satisfied the buyer. Is this concept right? Sorry, I still learn the basics
{quote} you're right, I'll learn to name the object with proper names . the grey line is demand zone. I'll sell USD if the USD price doesn't satisfied the buyer. Is this concept right? Sorry, I still learn the basics
Ignored
One more suggestion, when talking publicly its best to use common language... " if Usd price doesnt satisfied the buyer then I'll sell usd...!
This can be said as i will buy or go long from the mentioned support..☺....satisfying the buyers could be a difficult task...