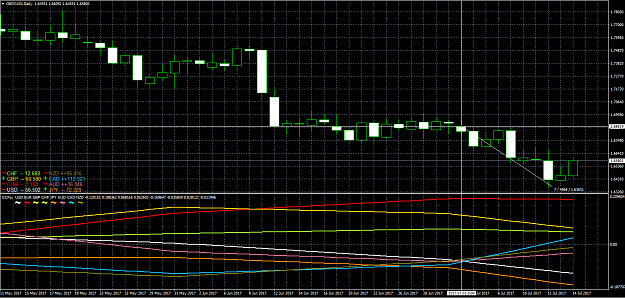
DislikedHey guys, Back for another update. I had some more time to implement virtual baskets in my excel analysis so can now optimize for entry/exit times, Sl/TP and virtual basket settings. I'll explain the way I worked my analysis as some people probably haven't read my previous posts. What I did is gather data with 1440 FT,10080 FT and 43200 FT and then averaged the respective baskets for every minute to get a graph like below. I then created 9 basket trades out of the observed trends with the entry and exit times as seen in the graph. {image} This puts...Ignored
Vincit qui se vincit.