Hi Guys,
I would like to share with you my long term bullish technical analysis of EURUSD for the next 02 years from now using the monthly chart.
http://pepperstone.ctrader.com/c/LWtpn
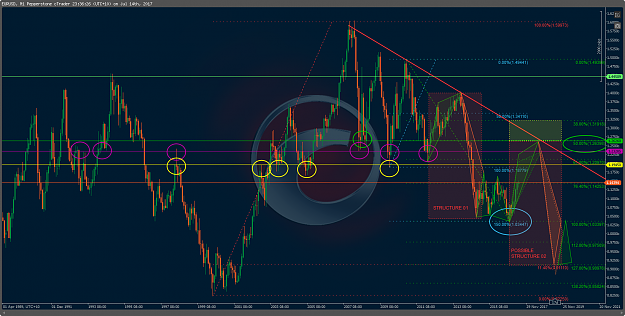
Please pay attention to the FIB levels: The light blue one indicates a FIB extension of precise 150%, which applying FIB inversal (light green one) makes the 50% retracement level at 1.2639, which also would touch the red trendline. Observe every time price touches the trendline the price absolutely collapses. Applying the same downtrend extension of Structure 01 in structure 02, the price goes down from 1.2639 to 0.90, which once again matches perfectly with the end of the whole 20-year-structure started in 1999 reaching the FIB 11.40% (red one) in July 2019.
Price is not suppose to go direct, of course, this is a long term analysis with plenty of opportunities for Bulls and bears.
The most important areas where price should find resistance are 1.1777, 1.1945, 1.2328, 1.2626.
I'm also considering a bearish move, but only if price holds where it is right now, because the strong resistance line is at 1.1445, once it keeps going up, it's not going to stop soon, only probably at the levels above mentioned.
If price holds I come back with my bearish analysis.
Good luck traders, don't forget to manage risk.
Constructive comments are welcomed.
I would like to share with you my long term bullish technical analysis of EURUSD for the next 02 years from now using the monthly chart.
http://pepperstone.ctrader.com/c/LWtpn
Please pay attention to the FIB levels: The light blue one indicates a FIB extension of precise 150%, which applying FIB inversal (light green one) makes the 50% retracement level at 1.2639, which also would touch the red trendline. Observe every time price touches the trendline the price absolutely collapses. Applying the same downtrend extension of Structure 01 in structure 02, the price goes down from 1.2639 to 0.90, which once again matches perfectly with the end of the whole 20-year-structure started in 1999 reaching the FIB 11.40% (red one) in July 2019.
Price is not suppose to go direct, of course, this is a long term analysis with plenty of opportunities for Bulls and bears.
The most important areas where price should find resistance are 1.1777, 1.1945, 1.2328, 1.2626.
I'm also considering a bearish move, but only if price holds where it is right now, because the strong resistance line is at 1.1445, once it keeps going up, it's not going to stop soon, only probably at the levels above mentioned.
If price holds I come back with my bearish analysis.
Good luck traders, don't forget to manage risk.
Constructive comments are welcomed.
Attached Image (click to enlarge)
Hey buddy, let's grab some Pips!
![Click to Enlarge
Name: EURUSD 170714 2H [1].png
Size: 111 KB](/attachment/image/2397587/thumbnail?d=1500045824)