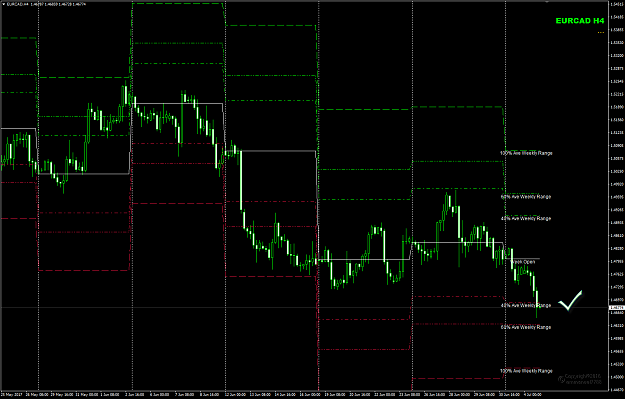
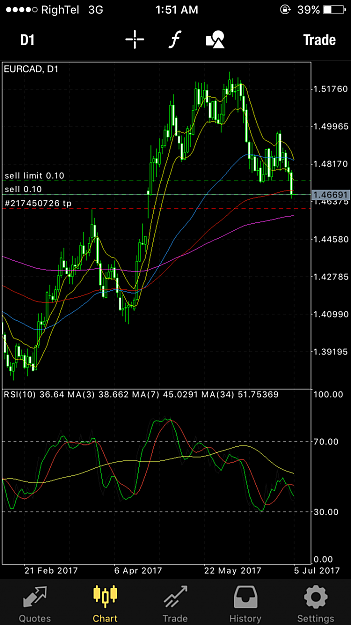
Disliked{quote} EURCAD Week 27 ME/ME trades Jul 04. Took my trade entry when Tokyo open today. ME trade distance 0.5ADR 100 which is abut 33 pips, round down to 30pips distance with TP every 30pips. So far, taken 90pips profits. {image}Ignored
Attached Image (click to enlarge)
1