Disliked" How does one "drive" a random price series resulting in a positive slope ? {image} .. still a WIP.Ignored
for me it is quite obvious that no system / method can extract money out of pure random walk series. The expectation value must be zero.
The reason for this is quite simple:
At timepoint x before the next random price change occours, you have to set Lot size and direction.
After these are set the next price change occurs randomly (non predictable)
However smart your Lot building or direction decision is, you can't brake through that wall of not knowing what happens in the next step.
No MM System will help you in the long run - things like Martingale or other techniques just distort what is obvious in giving you lots of small gains with an unconstraint risk.
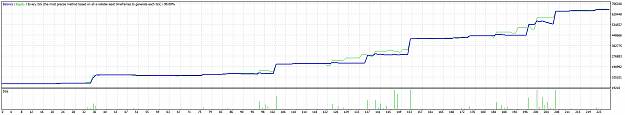
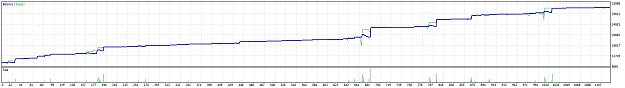
Looking at your P/L curve is see the following things:
1. Your lot size increases quite aggressivly to bring your cummulated position into the green with a next trade.
2. This looks a lot like martingale
3. In the calm phases you see a clear positive drift as Copernicus already mentioned - this is very typical for a random walk with asymmetric distribution
4. You mention a pressure valve. If there would be one, we should be able to see it work in your P&L curve.
Possibilities for the drift:
1. The random price series you use does already have a drift. In Excel that would correspond to acummulated series of =Randbetween(-50;51) steps. Such a series would still look random, but with a small tendency to rise. I think such a mistake is though quite unlikely, because you could see that easily if you run it a few times....
2. Your decision of direction is based on a mean value over a certain number of steps of either your price curve or your P&L curve. You probably have included into that mean value the price step you accually trade. This means the last value of your set is included in your decision of direction and this causes a hidden drift, because you include a value you shouldn't know at the time when you have to decide for direction. Let's say you use 10 values and the 10th of them is always in the right direction.....quess what, you get exactly what you show in your chart - a drift in the P&L. The same effect helps you also in not to blow up. This is why your pressure valve works, without generating a huge loss when it is in action at the point where the next trade must be taken in the right direction due to your martingale like lot increases.....
I do not get why you refer to Monty Hall, because in my opinion this is not directly related to what you show here. Since you hold back details, I think the main purpose of this thread is to keep some brains smoking.....? ;-)
Am I right?
3