Disliked{quote} Imega, from above 4 images i can roughly knew your setup based on low TF and divergence/TL, am I right? as i am still digesting your method, please give us more setup image to show us when to going in and where is SL/TP and also what factors need to consider before trade, how to deal with major news coming? thanks for your reply.Ignored
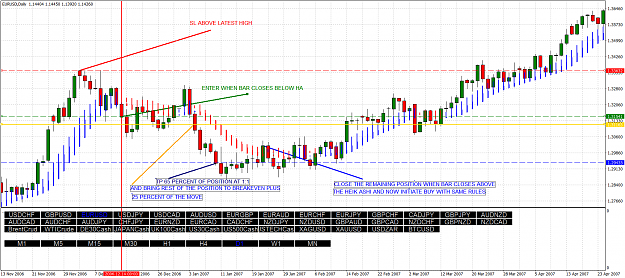
The above picture you are referring to is a trend continuation trade which I thought would be better to place it at the top, as the time passes I'll provide with live result and explanation of further kinds of trade setup and style like reversal etc. let's continue with trend continuation first. I'll also share some great findings which which no less than a real jackpot but you need to become through with the basics of this system.
Before we head on, I would like to mention something which has thought me some great ways to look at a particular chart. I'm not promoting but just mentioning as I have been a member of it for quite some time now . The community name is Forex Mentor Pro. what they thought is how to implement and use MA'S as a trade guide. The only MA'S I use is 34, 55, 200. EXPONENTIAL. MORE on this later. I mentioned it as in my further example this will be a reference point.
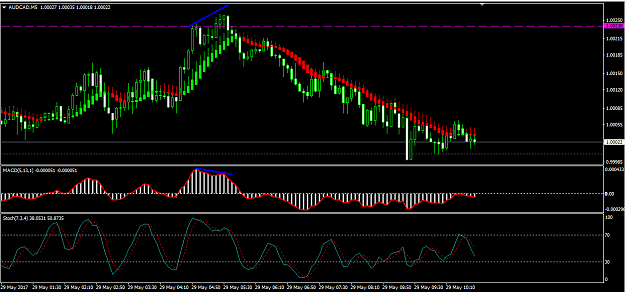
Let's look at AUDCAD Chart for now.
I also mentioned earlier that this system is not for beginners, If anyone starting out please learn basics at babypips first.
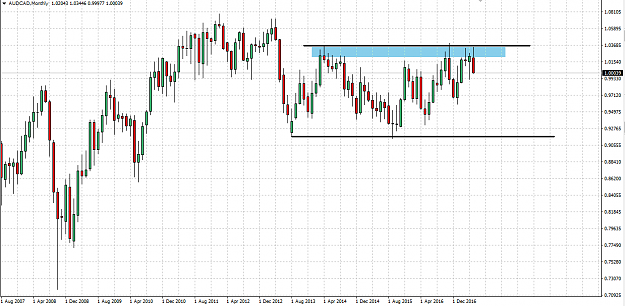
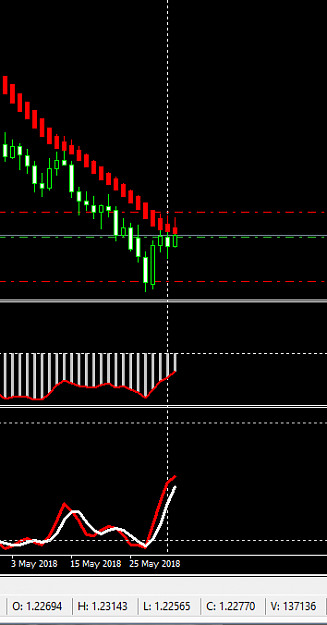
So without any indicator at first chart my wildest guess would be to go short on monthly TF with no analysis as the price has touched the resistance level and its coming back.
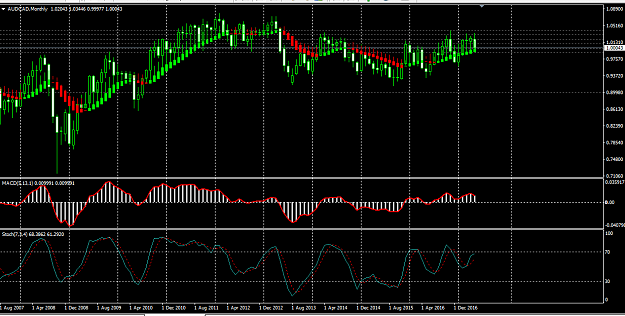
with the HEMc tlp, we can see the price coming near the heiken again which gives us a clue of two outcome Continue/ Reversal
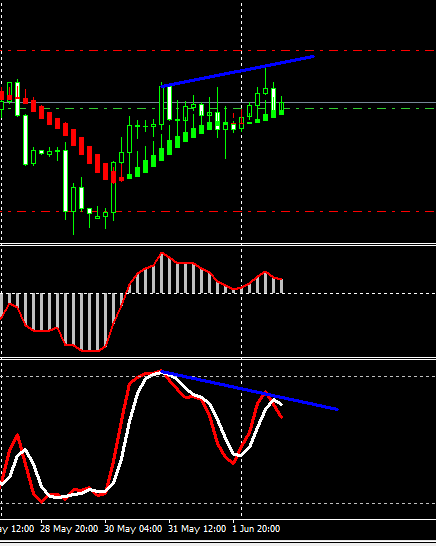
Also on my analytical chart it shows a TL break (plus point to our guess)
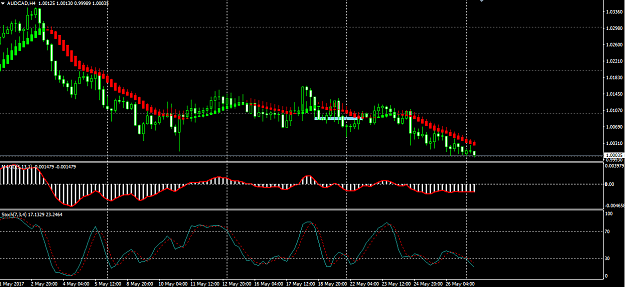
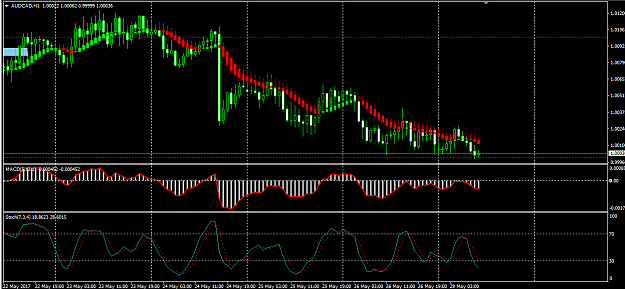
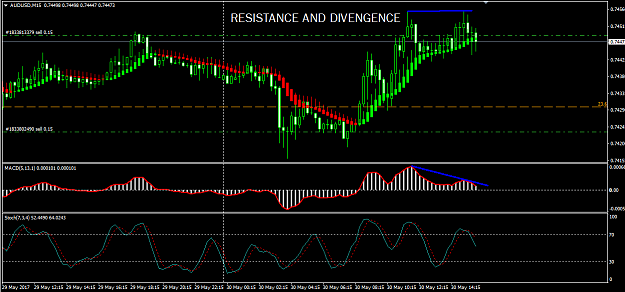
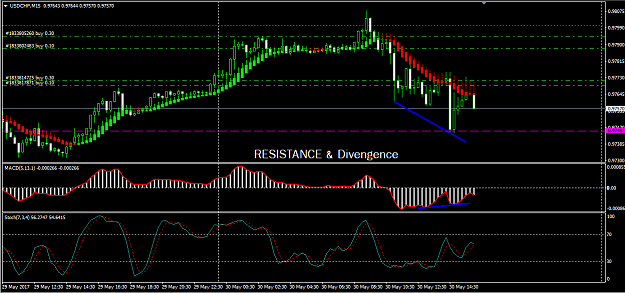
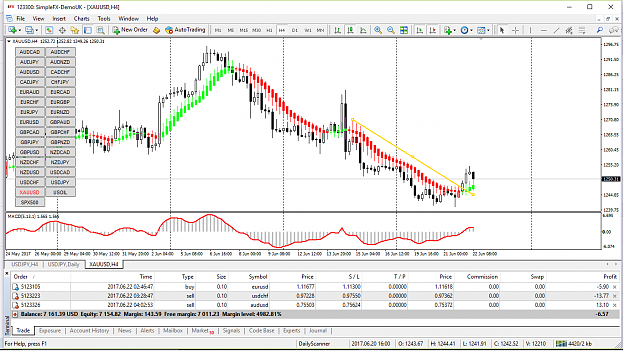
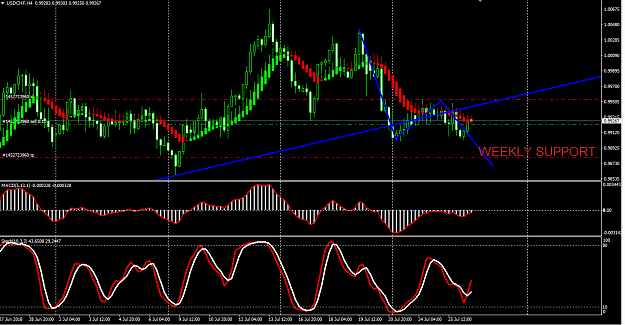
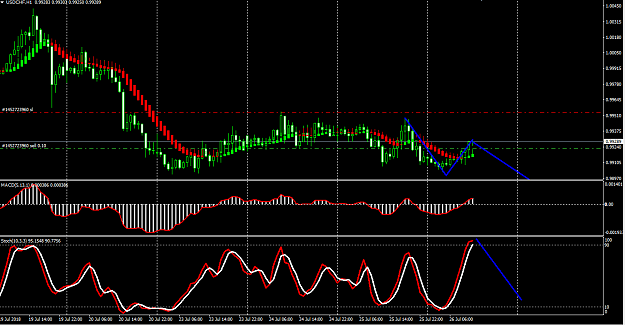
coming on 4 hr chart it does not give any signal of reversal, So here I could conclude with two possibilities continuation which is more in our favor or reversal. So if I get a nice stoch at overbought area being price bellow the TL break also known as retrace I would consider it to be a best trade, Now the important thing where to execute the trade if on 4hr chart stoch comes near overbought area or on 1 hr chart where the stoch has come near overbought area, the answer to this would be simple exactly near Daily/Pivotresistance but again how do you confirm it as a valid signal, The answer is dig more deeper and switch to smaller tf and look for divergence near pivot/resistance you will definitely get one if it has to reverse see bellow and there where you execute your trade with confidence same applies for bigger tf like 4hr, to execute find divergence on 30/15min chart. BUT how do you know if this trade is worth putting you hard earned money into risk ? That where MA'S are not to be neglected which can work as you potential target. If you put mentioned MA'S on your chart you'll find it has just broke the D 200 EMA and you could keep your target near next major MA which weekly or monthly 55 or 200, whith reference to this pair it could be anywhere around 0.99676 and so on.
I hope this explanation was readable and understandable, if you find any error typo do let me know and I'll fix it since I've written it in a very unpleasant environment with no mood to proofread .
ON TP and SL in coming posts.
Thanks for your time.
Green pips
Attached Image(s) (click to enlarge)