Disliked{quote} Thanks to you, Zoltan and Mik for your answersWhat do you mean by that? What's the difference between "order clusters" and the "edges of order flow"? Where are those located? Cheers!
Ignored
Cheers M
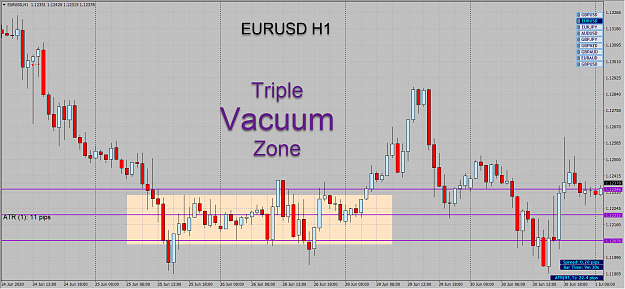
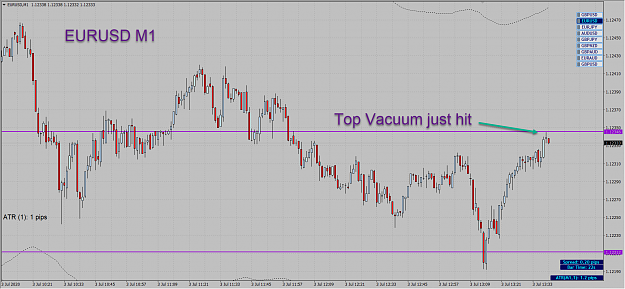
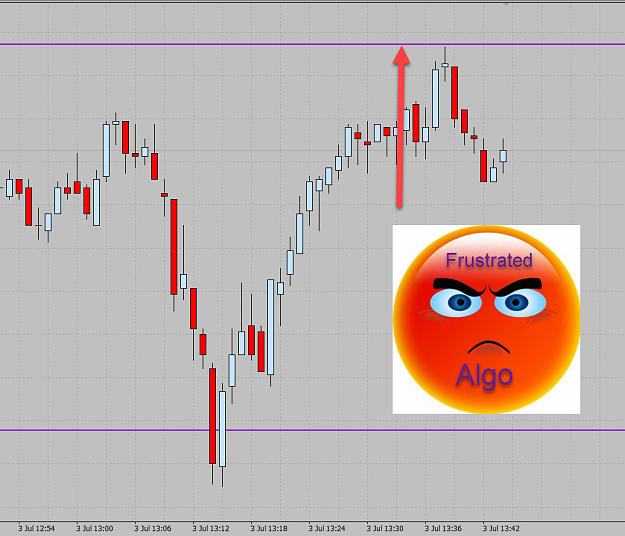
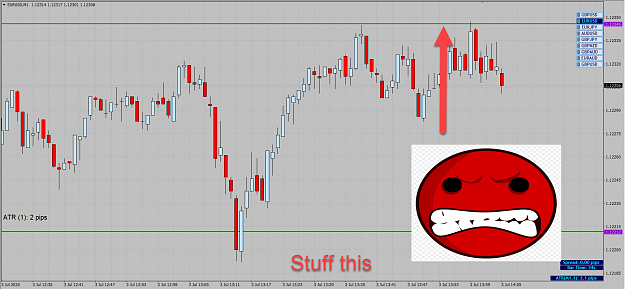
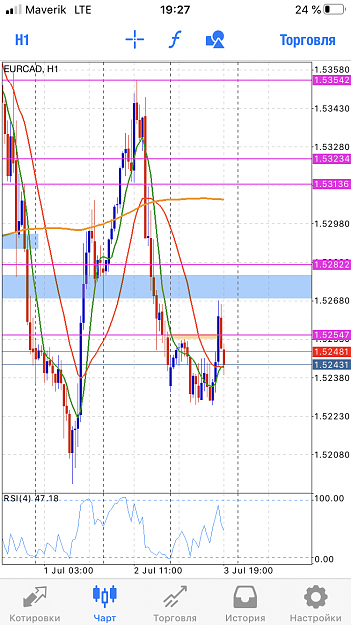
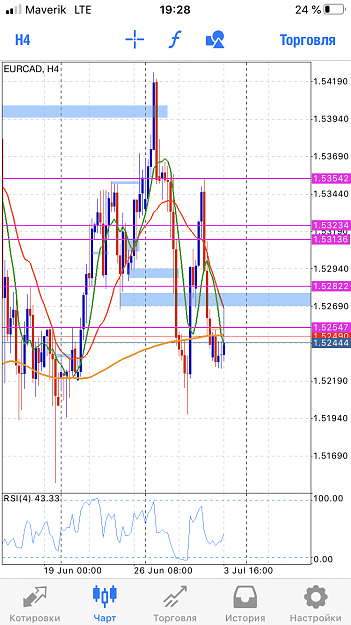
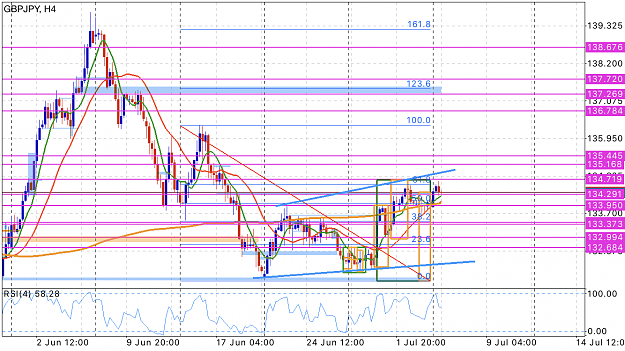
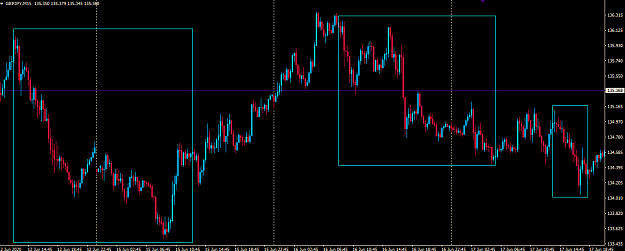
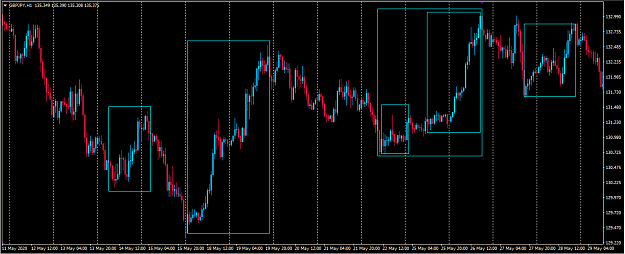
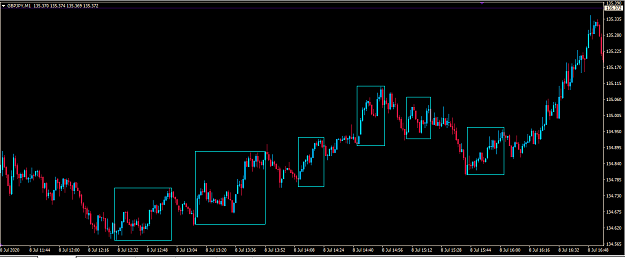
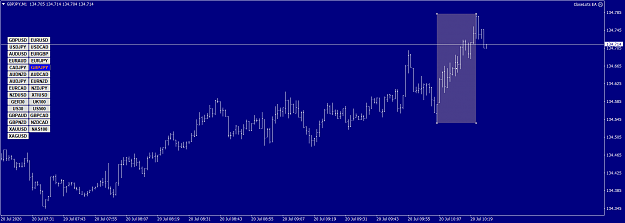
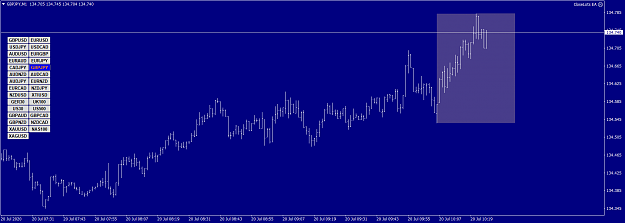
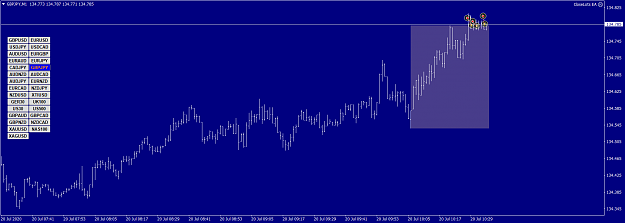
Attached Image (click to enlarge)
2