Hi,
Does any one scalp using 1-tick line chart, like the attached screenshots?
These screenshots show the last 10,000 ticks (in a span of about 20 minutes to 1 hour, depending on the volatility).
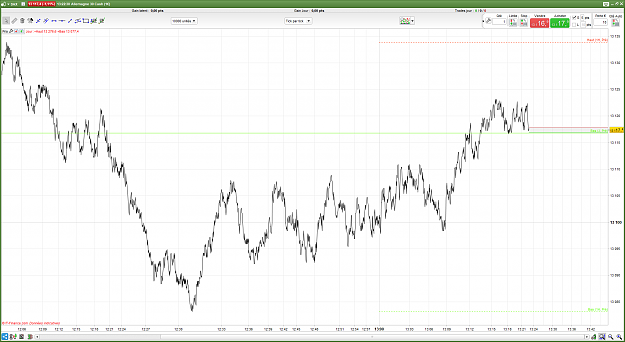
I am wondering if it is worth spending some screen time to get a feeling if this is tradable or if I should stick to candlestick charts.
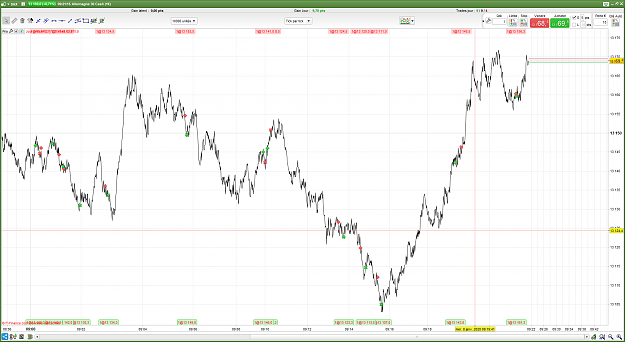
Does any one scalp using 1-tick line chart, like the attached screenshots?
These screenshots show the last 10,000 ticks (in a span of about 20 minutes to 1 hour, depending on the volatility).
Attached Image (click to enlarge)
Attached Image (click to enlarge)
I am wondering if it is worth spending some screen time to get a feeling if this is tradable or if I should stick to candlestick charts.