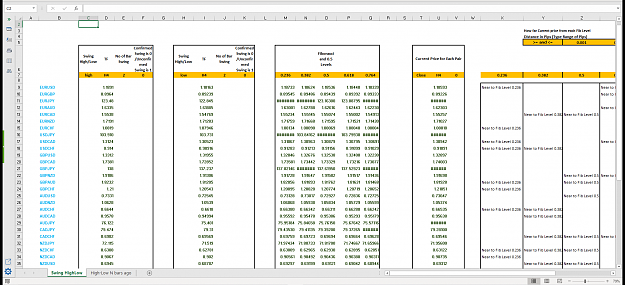
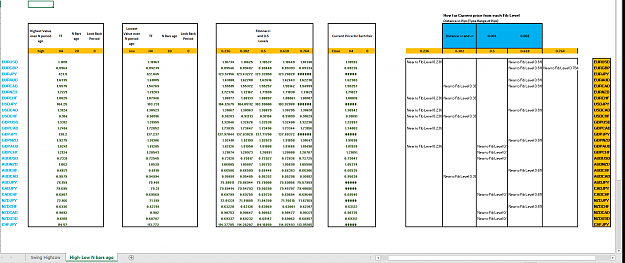
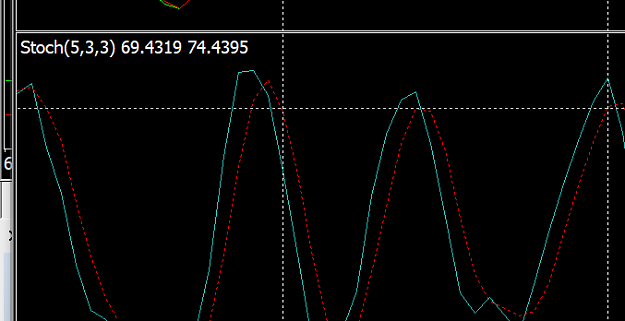
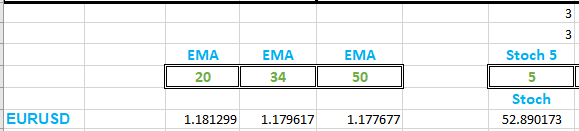
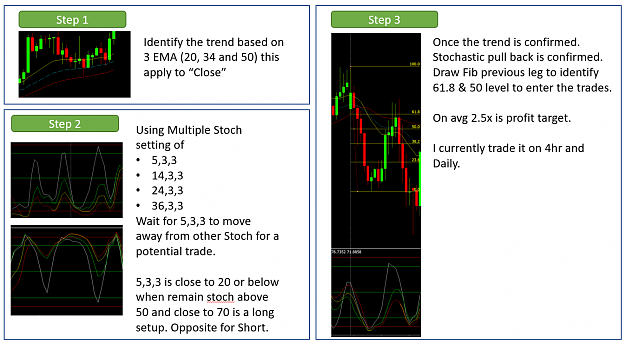
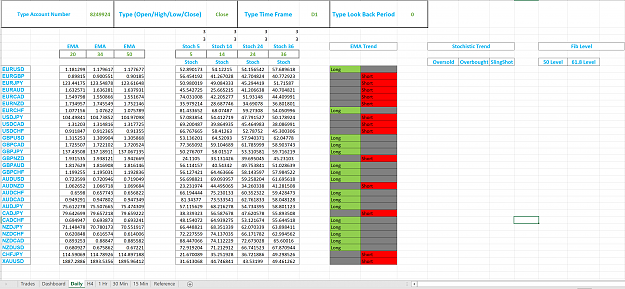
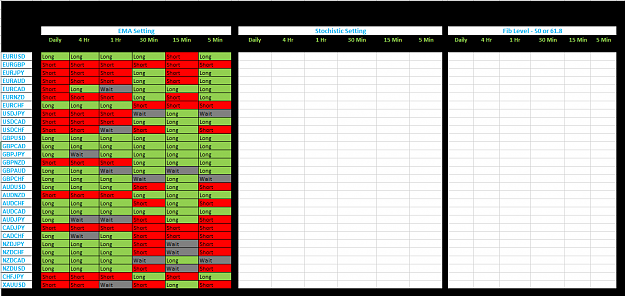
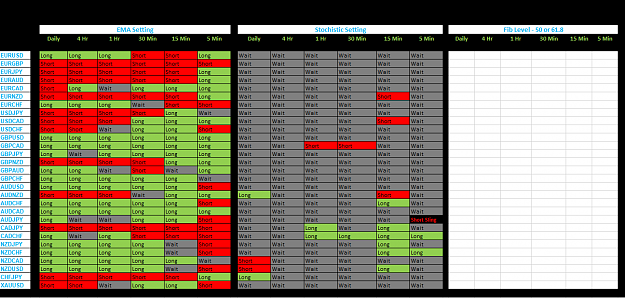
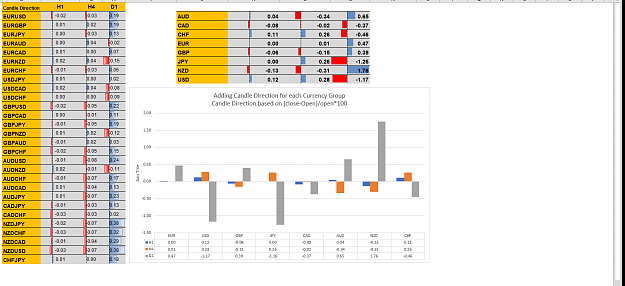
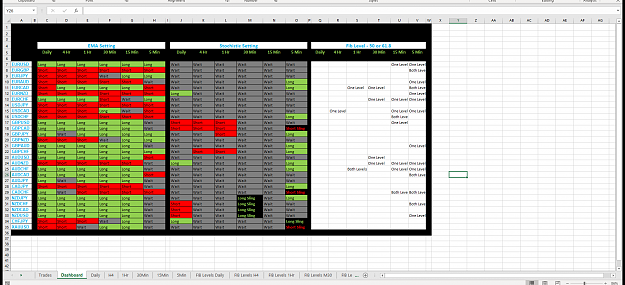
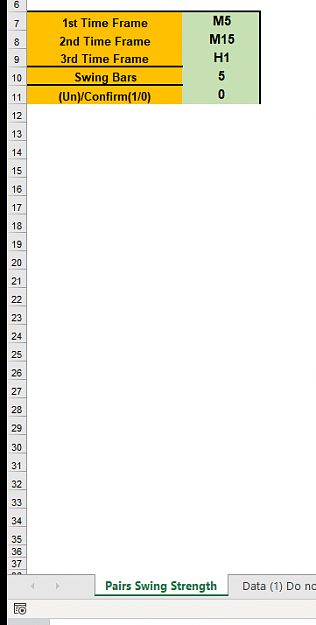
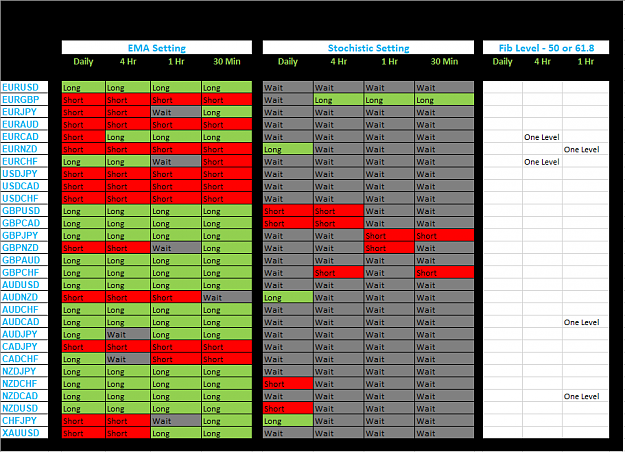
• Home
  • Forums
  • Trades
  • News
  • Calendar
  • Market
  • Brokers
  • Login
  • Join
  • User/Email: Password:
  • 12:52am
Menu
  • Forums
  • Trades
  • News
  • Calendar
  • Market
  • Brokers
  • Login
  • Join
  • 12:52am
Sister Sites
  • Metals Mine
  • Energy EXCH
  • Crypto Craft

Options

Bookmark Thread

First Page First Unread Last Page Last Post

Printable Version

Similar Threads

MT4 RTD API 0 replies

MT4 export to Excel? 8 replies

How to copy profiles in MT4? How to use Excel with MT4? 7 replies

Has anyone made an Excel spreadsheet to analyze your MT4 trades? 0 replies

Integration between excel and MT4 prices 3 replies

  • Platform Tech
  • /
  • Reply to Thread
  • Subscribe
  • 178
Attachments: MT4 to Excel through Excel RTD (Finally!)
Exit Attachments

MT4 to Excel through Excel RTD (Finally!)

  • Last Post
  •  
  • 1 67Page 8910 22
  • 1 7Page 89 22
  •  
  • Post #141
  • Quote
  • Nov 21, 2020 2:31am Nov 21, 2020 2:31am
  •  JibalaPasan
  • Joined Jun 2014 | Status: Member | 2,495 Posts
Quoting mtharwat
Disliked
{quote} I attached the previous indicators template with stochastics added. In case you need a list of other indicators, list them for me. {file}Still working on the Fibonacci levels.
Ignored
NaSap did it on her trading dashboard some years ago and it's very helpful in trading without to stare at the charts all the time.

https://www.forexfactory.com/thread/...55#post8438155

Best of luck and stay green always!

Jibala
PDF & BCC (Patience Discipline Focus & Belief Confidence Consistency)
  • Post #142
  • Quote
  • Nov 21, 2020 4:45am Nov 21, 2020 4:45am
  •  mtharwat
  • Joined Aug 2015 | Status: Member | 852 Posts
Quoting garfield75
Disliked
{quote} Hi mtharwat, Do you think it is possible to calculate in excel Fib levels from previous leg an trigger alerts when price reaches a specific level (61.8 or 50) ? Please share any other execl templates you have with RTD, I am trying to work out how to get multiple Stochatics values in there. Cheers Garfield75
Ignored

Hi garfield75,

I am attaching a workbook for Fibonacci calculations based on legs that has two sheets; each one of them has a different calculation.

The first sheet named "Swing High Low" is using the @swingh and @swingl indicators.
Attached Image (click to enlarge)
Click to Enlarge

Name: Swing High Low.png
Size: 83 KB

Swing high and swing low is basically the same as the fractals indicator. In other words, If I choose (2) for swing high, this means we will look for a bar that its high is higher than two previous highs and is followed by two lower highs. The only difference with the @swinh indicator is that there is an option to confirm or unconfirm the swing (i.e not waiting for the next two candles'highs to close lower).
So in the first sheet, you can do the following:

1- change Confirmed swing to unconfirmed by typing (0) or (1) respectively. (0) will give you the same result as the fractals indicator for high and low swing.
2- change (N) of Bar swing. If you want a fractal of 2 then type 2 or a fractal of 5 then type 5.
3-same thing applies on the Swing Low.
4-Change Time Frame

Then I calculated the range between the swing high and the swing low to get Fibonacci levels of this range.

The second sheet is named "High Low N bars ago"
Attached Image (click to enlarge)
Click to Enlarge

Name: High Low N Bars ago.png
Size: 48 KB


The calculation is different as in this sheet you can get the highest high and the lowest low based on (N) bars ago that you specify. For example, if you want to find fibonacci levels between the highest high and the lowest low over the last 20 bars, then you type 20.

In this sheet you can do the following:
1- change time frame
2-Change the number of bars to find the highest high and lowest low. You can input 10 or 20 or 100, etc..
3- Change how far the distance between current price and any fib level should be. For example, If I want to know if price is about 15 pips far from a fib level, then I can specify the range as 0.0010 and 0.0020 (10-20 pips)

I then calculated fib levels based on the range between the highest high and lowest low.

------------------------------------------------------

Now, there is something you should be aware of:

As you already know, in order to calculate Fibonacci right, if we have a bullish trend i.e( the highest high appeared in time after the lowest low), then the 0.38% retracement should be closer to the lowest low.
The opposite is true if we have a bearish trend.

In order to find the right time when the highest height or lowest low did occur, I could not find a straightforward indicator from FX BLUE Labs to give me the exact time. For example, a 0.38 retracement in a bullish trend will be a 0.618 retracement in a bearish trend.
The way around it is to get the last 10 or 20 bars highs and lows which I initially did and looked up the value of the max highs and lows to find the time of occurrence but it was very resource-intensive and may lead to crashes. Imagine multiplying 28 pairs by 10 for readings of high and lows and another 28 X 2 for time.

So in short, all calculations assume bullish trends. The idea is that price is approaching or leaving a fib level within a certain range albeit the fib level may be 0.38 / 0.618 or 0.23/0.764 etc..

-------------------------------------

Excel has a built-in hyperlink formula to send an email but we need a VBA to automatically reference a cell and send email without clicking on sending an email. I assume a VBA may help but I do not have it.

---------------------------------
Let me know if the workbook is of help.
Attached File
File Type: xlsx Fibs Calculation.xlsx   34 KB | 62 downloads
1
  • Post #143
  • Quote
  • Nov 21, 2020 4:59am Nov 21, 2020 4:59am
  •  mtharwat
  • Joined Aug 2015 | Status: Member | 852 Posts
Quoting JibalaPasan
Disliked
{quote} NaSap did it on her trading dashboard some years ago and it's very helpful in trading without to stare at the charts all the time. https://www.forexfactory.com/thread/...55#post8438155 Best of luck and stay green always! Jibala
Ignored

garfield75 was initially asking for retrieving indicators values through Excel RTD. Nasap's post is about using EXCEL DDE and the latter is very limited and does not provide indicators readings.

Even for Fib levels, DDE can only provide values based on the current High and Low of the day but not other time frames.
  • Post #144
  • Quote
  • Nov 21, 2020 5:23am Nov 21, 2020 5:23am
  •  garfield75
  • Joined Jan 2009 | Status: Member | 614 Posts
Quoting mtharwat
Disliked
{quote} Hi garfield75, I am attaching a workbook for Fibonacci calculations based on legs that has two sheets; each one of them has a different calculation. The first sheet named "Swing High Low" is using the @swingh and @swingl indicators. {image} Swing high and swing low is basically the same as the fractals indicator. In other words, If I choose (2) for swing high, this means we will look for a bar that its high is higher than two previous highs and is followed by two lower highs. The only difference with the @swinh indicator is that there is...
Ignored
hey mtharwat,

Wow !! this is amazing, will need a day to digest this and post a detail reply on Monday!

THANK YOU
Trading is SIMPLE not EASY.
ExcelRTD Return This Month: 11.3%
  • Post #145
  • Quote
  • Nov 21, 2020 6:21pm Nov 21, 2020 6:21pm
  •  garfield75
  • Joined Jan 2009 | Status: Member | 614 Posts
Any idea why the Stochistc values are different between MT4 chart and excel RTD.
Using the EURUSD Daily chart as an example.
Attached Image (click to enlarge)
Click to Enlarge

Name: 1fda0b830d6d5eeb0a72750d8919510c.png
Size: 20 KB
Attached Image
Trading is SIMPLE not EASY.
ExcelRTD Return This Month: 11.3%
  • Post #146
  • Quote
  • Edited Nov 22, 2020 2:27am Nov 21, 2020 7:08pm | Edited Nov 22, 2020 2:27am
  •  garfield75
  • Joined Jan 2009 | Status: Member | 614 Posts
Quoting mtharwat
Disliked
{quote} garfield75 was initially asking for retrieving indicators values through Excel RTD. Nasap's post is about using EXCEL DDE and the latter is very limited and does not provide indicators readings. Even for Fib levels, DDE can only provide values based on the current High and Low of the day but not other time frames.
Ignored
Hi Mtharwat,

Thought it would be good to share my current strategy to give you some context on why I am requesting Fib and Stoch indicator.
I feel if we can get this setting on Excel and then have 1 excel dashboard which can show all pairs and timeframe and give alerts on which timeframe and pair there is a setup to take a trade. Currently, it is a very manual process to go though each chart and timeframe to identify trades, that is why I only trade it on daily and 4 hours timeframe.
Do you think something like this would be possible to do on EXCEL RTD?
Sending emails or SMS or Telegram Chat alert from excel is not a problem I have done that in the past of we can easily incorporate that bit.

Cheers
Garfield
Attached Images (click to enlarge)
Click to Enlarge

Name: 6abf50e4612d44837d4695fa2d8180a2.png
Size: 165 KB Click to Enlarge

Name: 7a3a94c2fd64edc676508f6f2e363265.png
Size: 475 KB Click to Enlarge

Name: cce88459481c06d141cba92dd81bc1b2.png
Size: 81 KB
Trading is SIMPLE not EASY.
ExcelRTD Return This Month: 11.3%
  • Post #147
  • Quote
  • Nov 22, 2020 6:16am Nov 22, 2020 6:16am
  •  mtharwat
  • Joined Aug 2015 | Status: Member | 852 Posts
Quoting blablabla
Disliked
Does anyone know how to import account history/ Active Orders in to excel? Automatically, without copy and pasting the CSV? thx,
Ignored
Hi blablabla,

Sorry I missed your post.
Other than what we can import through the EXCEL RTD, I am afraid we can not..
  • Post #148
  • Quote
  • Nov 22, 2020 6:39am Nov 22, 2020 6:39am
  •  mtharwat
  • Joined Aug 2015 | Status: Member | 852 Posts
Quoting garfield75
Disliked
Any idea why the Stochistc values are different between MT4 chart and excel RTD. Using the EURUSD Daily chart as an example. {image} {image}
Ignored
Thank you for checking the indicator's values with MT4.
It was a mistake from my part as I referenced "close" within the indicator and it was unnecessary and influenced the output value somehow.

I am reattaching the same workbook with corrected stochastics. I checked it from my end. Check it please from your end and any other indicator.
Attached File
File Type: xlsx Indicators Data with Concat Function (Stochastics added) (Corrected).xlsx   31 KB | 70 downloads
  • Post #149
  • Quote
  • Nov 22, 2020 6:58am Nov 22, 2020 6:58am
  •  mtharwat
  • Joined Aug 2015 | Status: Member | 852 Posts
Quoting garfield75
Disliked
{quote} Hi Mtharwat, Thought it would be good to share my current strategy to give you some context on why I am requesting Fib and Stoch indicator. I feel if we can get this setting on Excel and then have 1 excel dashboard which can show all pairs and timeframe and give alerts on which timeframe and pair there is a setup to take a trade. Currently, it is a very manual process to go though each chart and timeframe to identify trades, that is why I only trade it on daily and 4 hours timeframe. Do you think something like this would be possible to...
Ignored

----If you are able to work on the SMS alert, it will be great. I was trying to find a VBA to record the time of occurrence of conditions but did not find one. An email or similar will be great to get notified and to backtest when conditions are met. I will be using this to test group currency strength.

-----Let us break your strategy into pieces.
What you wish to do is to have a dashboard across multiple time frames (6 from your picture) and you have 7 indicators/requests from EXCEL RTD and one indicator/request for the current price. So initially you will need 6*7*28 requests/indicators from EXCEL RTD. I can give it a try and if it freezes, then we can split the dashboard into two workbooks (one for HTF and one for LTF).
After that, we can apply two more indicators/requests from EXCEL RTD for FIB calculations. The good thing is that this condition will be the last one and will be applicable only to the pairs that have their conditions met.

The logic will be simple in implementing it. I would use the IF condition for each indicator and if fulfilled give it a value of one. If the sum of all values equals the number of conditions, then "Conditional Formatting"or alert/email.

---------------

If you can attach the last sheet in your photos (the one with EMA Setting/Stochastic setting/Fib 50) that you are using, I can build it up to the format you are looking for. I will reference the values in this sheet and make it the dashboard sheet. And...Let's see if it freezes or not. We need to try first.
1
  • Post #150
  • Quote
  • Nov 22, 2020 10:25am Nov 22, 2020 10:25am
  •  garfield75
  • Joined Jan 2009 | Status: Member | 614 Posts
Quoting mtharwat
Disliked
{quote} Thank you for checking the indicator's values with MT4. It was a mistake from my part as I referenced "close" within the indicator and it was unnecessary and influenced the output value somehow. I am reattaching the same workbook with corrected stochastics. I checked it from my end. Check it please from your end and any other indicator. {file}
Ignored
Thank you. Updated template now displays the values correctly.
Trading is SIMPLE not EASY.
ExcelRTD Return This Month: 11.3%
  • Post #151
  • Quote
  • Edited at 11:07am Nov 22, 2020 10:30am | Edited at 11:07am
  •  garfield75
  • Joined Jan 2009 | Status: Member | 614 Posts
Quoting mtharwat
Disliked
{quote} ----If you are able to work on the SMS alert, it will be great. I was trying to find a VBA to record the time of occurrence of conditions but did not find one. An email or similar will be great to get notified and to backtest when conditions are met. I will be using this to test group currency strength. -----Let us break your strategy into pieces. What you wish to do is to have a dashboard across multiple time frames (6 from your picture) and you have 7 indicators/requests from EXCEL RTD and one indicator/request for the current price. So...
Ignored
Please see attached xls. It is still work-in-progress.
Agree it might have some issues with performance and may freeze during active market.
Attached Image (click to enlarge)
Click to Enlarge

Name: 082d3b1a58dfb70ec70853ffd8429510.png
Size: 87 KB
Attached File
File Type: xlsx GF-RTD - V01.xlsx   78 KB | 70 downloads
Trading is SIMPLE not EASY.
ExcelRTD Return This Month: 11.3%
  • Post #152
  • Quote
  • Nov 22, 2020 8:04pm Nov 22, 2020 8:04pm
  •  mtharwat
  • Joined Aug 2015 | Status: Member | 852 Posts
Quoting garfield75
Disliked
{quote} Please see attached xls. It is still work-in-progress. Agree it might have some issues with performance and may freeze during active market. {file} {image}
Ignored
I will work on it.
  • Post #153
  • Quote
  • Edited at 10:54pm Nov 22, 2020 8:06pm | Edited at 10:54pm
  •  mtharwat
  • Joined Aug 2015 | Status: Member | 852 Posts
Candlestick Direction in MTF

A simple workbook to find candlestick direction in multi-timeframe and the percentage of the move (close - open)/open *100.
Then I added the %move for each currency group.

The first column on the left has all pairs and their candle directions.

Attached Image (click to enlarge)
Click to Enlarge

Name: 2020-11-23 (1).png
Size: 78 KB
Attached File
File Type: xlsx Candlestick Direction.xlsx   45 KB | 62 downloads
  • Post #154
  • Quote
  • Nov 22, 2020 10:49pm Nov 22, 2020 10:49pm
  •  mtharwat
  • Joined Aug 2015 | Status: Member | 852 Posts
Quoting garfield75
Disliked
{quote} Please see attached xls. It is still work-in-progress. Agree it might have some issues with performance and may freeze during active market. {file} {image}
Ignored

Hi garfield,

Attached Image (click to enlarge)
Click to Enlarge

Name: 2020-11-23.png
Size: 105 KB


Attached your workbook with FIBS. When the cell says "one level", it is either 0.5 or 61.8. I followed the same logic you want in the dashboard.
When it says "both levels", it means the price is close to both 50 and 61.8 within the range of pips that you specify.
The range of pips can be specified from within the added sheets for fib level calculations at the top right. Each timeframe can be adjusted to preference.

I used (@swing indicator) to act the same as confirmed fractals in MT4 to provide the most recent swing (High or Low) based on your input. I believe you may need to adjust this parameter for each time frme. For example, if the (swing bar number) is 2, then @swing High will look for the bar that has two previous low highs and is followed by confirmed two lower lows. Each time frame would need its own adjustment.

--------

One limitation:
0.618 level means 0.618 or 0.382 depending on the trend Bullish or Bearish.
There is a workaround it but we will need more requests.
Test this template now to see if it is crashing or not during active hours.
If you do not want to have 0.382 levels and just prefer 0.618 levels for deep retracement, then I can figure a solution around it. (If you remember my previous post about this in particular). We just need to find which swing happened first in time. It is doable.
Attached File
File Type: xlsx GF-RTD - V01 (with FIBS).xlsx   125 KB | 76 downloads
  • Post #155
  • Quote
  • Nov 22, 2020 11:21pm Nov 22, 2020 11:21pm
  •  mtharwat
  • Joined Aug 2015 | Status: Member | 852 Posts
@Garfiled

To better understand the @swing indicator, put the Fractals indicator in MT4. The latter is using 2 bar swing. There are custom indis which allows the change of the (2 bar swing) to other number. I currently do not have.

When you place the fractals you will instantly understand the logic of calculations of the @swing indicator. I believe all the Automatic FIB indicators for MT4 are using the fractals logic albeit with changing the number of swing bars (Any one can correct me if I am wrong).

====================

In the meantime, do not forget the other way to calculate Fibonacci based on the highest high and lowest low over the user-specified last No of Bars per time frame. (The second sheet in my previous workbook).
This one is also a great alternative if you wish to use it instead.
For example, we can assign Fibonacci to be drawn based on the last 20 bars. (highest high and lowest low of these 20 bars) will be our base for calculations.

---------------------------

Regardless of the approach, we can still find which high or which low happened first in time, so we can determine if Fibonacci levels are in a downtrend or a bullish trend.
---
I hope I have not confused you as this point is important to understand.
  • Post #156
  • Quote
  • Nov 22, 2020 11:30pm Nov 22, 2020 11:30pm
  •  garfield75
  • Joined Jan 2009 | Status: Member | 614 Posts
Quoting mtharwat
Disliked
@Garfiled To better understand the @swing indicator, put the Fractals indicator in MT4. The latter is using 2 bar swing. There are custom indis which allows the change of the (2 bar swing) to other number. I currently do not have. When you place the fractals you will instantly understand the logic of calculations of the @swing indicator. I believe all the Automatic FIB indicators for MT4 are using the fractals logic albeit with changing the number of swing bars. ==================== In the meantime, do not forget the other way to calculate Fibonacci...
Ignored
@mtharwat,

Will check the file during London session today. I prefer the Fractal approach to calculate fib level instead of x number of past bars which can cause issue during ranging market IMHO.

Looking forward to testing this today

Cheers
Trading is SIMPLE not EASY.
ExcelRTD Return This Month: 11.3%
  • Post #157
  • Quote
  • Edited at 3:34am Nov 23, 2020 1:43am | Edited at 3:34am
  •  mtharwat
  • Joined Aug 2015 | Status: Member | 852 Posts
Single Pairs' Strength and Currency strength based on Fractals/swing indicator...

Attached Image (click to enlarge)
Click to Enlarge

Name: 2020-11-23 (3).png
Size: 13 KB

The 'Pairs Swing Strength' Sheet has 5 inputs you can change.

The first three are for time frames.
The fourth input (Swing Bars) are for choosing how many bars for the swing. (2) is same as Fractals indicator in MT4
The fifth input is for either confirming the swing or to leave it unconfirmed. (confirmed) will yield the same results as fractals indicator in MT4

These cells are Master cells and the workbook references from them.

Edit: Forgot to add that the calculation is based on the close of the Fractal/Swing bar not its Low/High.
I may do another one later on based on the High and Low,
Attached File
File Type: xlsx CSM Based on Fractals.xlsx   46 KB | 50 downloads
  • Post #158
  • Quote
  • Nov 23, 2020 1:56am Nov 23, 2020 1:56am
  •  mtharwat
  • Joined Aug 2015 | Status: Member | 852 Posts
Quoting garfield75
Disliked
{quote} @mtharwat, Will check the file during London session today. I prefer the Fractal approach to calculate fib level instead of x number of past bars which can cause issue during ranging market IMHO. Looking forward to testing this today Cheers
Ignored
I agree with you.
  • Post #159
  • Quote
  • Nov 23, 2020 3:11am Nov 23, 2020 3:11am
  •  garfield75
  • Joined Jan 2009 | Status: Member | 614 Posts
Quoting mtharwat
Disliked
{quote} I agree with you.
Ignored
I am used to trading 4 hr charts, going down to 5Min TF seems to be noisy. Daily, 4hr, 1hr and 30Min seems to be align to my style.
Not sure if the Fib is doing what I would like it to do, which is to draw 61.8% level depending on the trend. (up or down)
Attached Image (click to enlarge)
Click to Enlarge

Name: 2262121552d18b3e1f24f7dcc8369ede.png
Size: 78 KB
Trading is SIMPLE not EASY.
ExcelRTD Return This Month: 11.3%
  • Post #160
  • Quote
  • Nov 23, 2020 3:20am Nov 23, 2020 3:20am
  •  mtharwat
  • Joined Aug 2015 | Status: Member | 852 Posts
Quoting garfield75
Disliked
{quote} I am used to trading 4 hr charts, going down to 5Min TF seems to be noisy. Daily, 4hr, 1hr and 30Min seems to be align to my style. Not sure if the Fib is doing what I would like it to do, which is to draw 61.8% level depending on the trend. (up or down) {image}
Ignored
I will look into it after the session.
I may need to retrieve the last 20 bars for each timeframe to make sure the swing occurred within these bars. I think 20 is enough. 10 bars was not enough for all pairs when I sampled it once.
  • Platform Tech
  • /
  • MT4 to Excel through Excel RTD (Finally!)
  • Reply to Thread
    • 1 67Page 8910 22
    • 1 7Page 89 22
0 traders viewing now
  • More
Top of Page
  • Facebook
  • Twitter
About FF
  • Mission
  • Products
  • User Guide
  • Media Kit
  • Blog
  • Contact
FF Products
  • Forums
  • Trades
  • Calendar
  • News
  • Market
  • Brokers
  • Trade Explorer
FF Website
  • Homepage
  • Search
  • Members
  • Report a Bug
Follow FF
  • Facebook
  • Twitter

FF Sister Sites:

  • Metals Mine
  • Energy EXCH
  • Crypto Craft

Forex Factory® is a brand of Fair Economy, Inc.

Terms of Service / ©2021