EDIT: 15/08/2021
1- Some wrong formulas when calculating Price Action Pairs Strength and calculating Pairs Strength based on indicators.
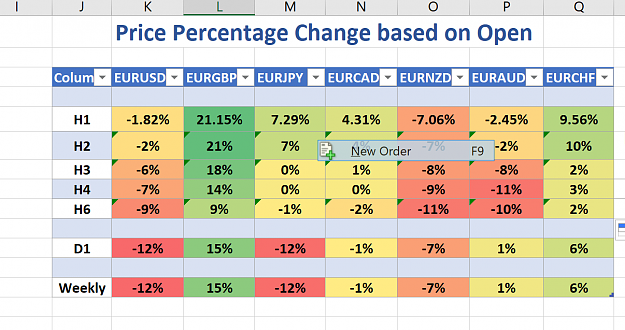
I have before shared a couple of templates that calculate percentage change for Individual currencies. I believe I have shared one for DDE and another for Excel RTD.
There is something wrong with the formula and I am correcting it here. If you do not know how to correct the formula in the template, ask me and provide the template and I will correct it for you.
The wrong calculation also applies to dashboards with indicators. For example: Using one or two MAs for calculating strength per pair.
The way to calculate percentage Change in Excel is:
If Current > Open then (Current - Low) / (High - Low) * 100
If current < Open then (Current - High) / (High - Low) * 100
What I have before done wrong was using the same formula (top one) for the second case when Current is lower than open. The same principle shoul apply to other templates/dashboards that use indicators instead of price action.
2- Another mistake is when calculating the inverse of RSI value:
In order to calculate the average strength of RSIs for a currency pair, we may calculate the average of RSIs among every seven pairs for each of the eight currency groups.
For example RSI of EURUSD + RSI of EURJPY, etc..... Then add the seven values and divide them by 7.
What I did wrong is calculating the inverse of pairs by multiplying -1 * RSI of EURUSD to get the value USDEUR.
The correct formula is 100 - RSI of EURUSD.
For example, if EURUSD RSI = 70 then RSI of USDEUR = 100-70=30 and not -1*70.
When we have an oscillator that only oscillates between 0 and 100 then the inverse of any pair's indicator will be to subtract the value of 100.
------------------------
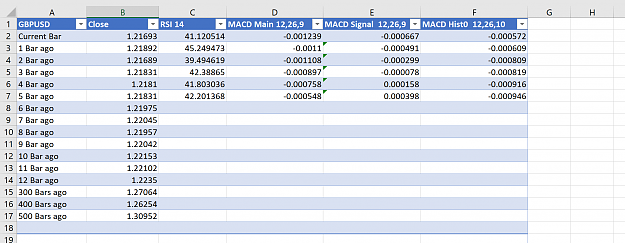
I have been searching over and over for countless hours until I found "Excel RTD". It is magic! I am able to get up to 500-period bars (depends on your broker) from MT4 history without exporting any data from MT4. Moreover, the current row keeps updating its self until the period is over and then a new row starts on top with the new updating values. Finally!!!
It is an EA that you apply on a MT4/MT5 chart and then open your Excel and type in a formula/s to get OHLC/Volume for current bars and up to 500 bars ago.
The same thing can be applied for most (if not all-need to check) of the indicators in MT4. Even if you have a custom indicator, you just need to know its formula and use what is available. For Example, a cross of RSI with MA is easy to apply because you can get your RSI values and apply a smoothing MA to the RSI column. Even Ketner Channels can be applied.
------------------------------------------------------------
By googling Excel RTD + MT4, you will find many brokers offering this EA. Check if your broker has it or check if any of the other brokers provides the EA in a demo account. I found that my broker (Pepperstone) has this Excel RTD through its "Smart Tools" set of indis/EAs. I was surprised that I did not know it could retrieve history bars. There are other brokers and you will easily find them by searching online.
-------------------
Examples for what I mean:
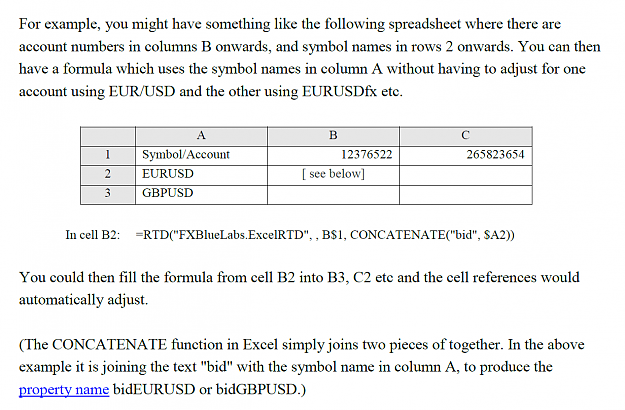
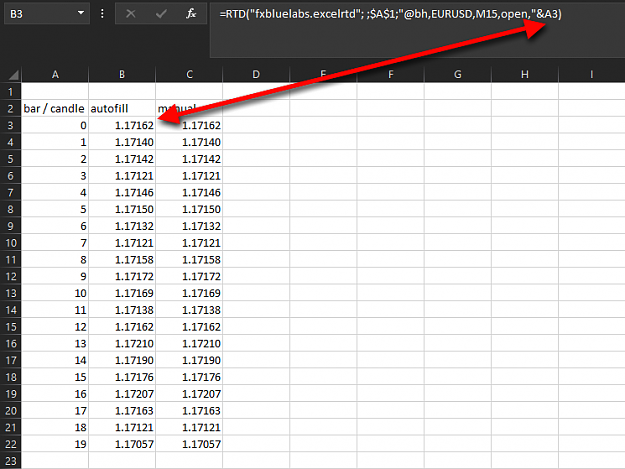
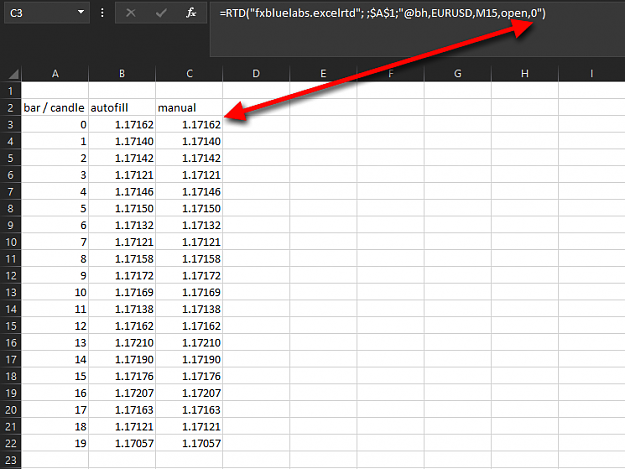
=RTD("fxbluelabs.excelrtd", ,"account number", "@bh,GBPUSD,H4,close,1") will get you the last close bar. Change the number at the end to 0 and you get current bar. Or change it to 200 and you get bar number 200.
=RTD("fxbluelabs.excelrtd", ,"account number","@rsi,GBPUSD,H4,14,2") will get you RSI value for H4 two bars ago.
Do not panic from these formulas. These are copy-pasted from a long PDF each broker (that has this Excel RTD EA through fxbluelabs) will provide it for you. The PDFs vary from one broker to another with how descriptive they are.
------------
Some PDFs:
From peperstone:
From JFD :
From ThinkMArkets:
1- Some wrong formulas when calculating Price Action Pairs Strength and calculating Pairs Strength based on indicators.
I have before shared a couple of templates that calculate percentage change for Individual currencies. I believe I have shared one for DDE and another for Excel RTD.
There is something wrong with the formula and I am correcting it here. If you do not know how to correct the formula in the template, ask me and provide the template and I will correct it for you.
The wrong calculation also applies to dashboards with indicators. For example: Using one or two MAs for calculating strength per pair.
The way to calculate percentage Change in Excel is:
If Current > Open then (Current - Low) / (High - Low) * 100
If current < Open then (Current - High) / (High - Low) * 100
What I have before done wrong was using the same formula (top one) for the second case when Current is lower than open. The same principle shoul apply to other templates/dashboards that use indicators instead of price action.
2- Another mistake is when calculating the inverse of RSI value:
In order to calculate the average strength of RSIs for a currency pair, we may calculate the average of RSIs among every seven pairs for each of the eight currency groups.
For example RSI of EURUSD + RSI of EURJPY, etc..... Then add the seven values and divide them by 7.
What I did wrong is calculating the inverse of pairs by multiplying -1 * RSI of EURUSD to get the value USDEUR.
The correct formula is 100 - RSI of EURUSD.
For example, if EURUSD RSI = 70 then RSI of USDEUR = 100-70=30 and not -1*70.
When we have an oscillator that only oscillates between 0 and 100 then the inverse of any pair's indicator will be to subtract the value of 100.
------------------------
I have been searching over and over for countless hours until I found "Excel RTD". It is magic! I am able to get up to 500-period bars (depends on your broker) from MT4 history without exporting any data from MT4. Moreover, the current row keeps updating its self until the period is over and then a new row starts on top with the new updating values. Finally!!!
It is an EA that you apply on a MT4/MT5 chart and then open your Excel and type in a formula/s to get OHLC/Volume for current bars and up to 500 bars ago.
The same thing can be applied for most (if not all-need to check) of the indicators in MT4. Even if you have a custom indicator, you just need to know its formula and use what is available. For Example, a cross of RSI with MA is easy to apply because you can get your RSI values and apply a smoothing MA to the RSI column. Even Ketner Channels can be applied.
------------------------------------------------------------
By googling Excel RTD + MT4, you will find many brokers offering this EA. Check if your broker has it or check if any of the other brokers provides the EA in a demo account. I found that my broker (Pepperstone) has this Excel RTD through its "Smart Tools" set of indis/EAs. I was surprised that I did not know it could retrieve history bars. There are other brokers and you will easily find them by searching online.
-------------------
Examples for what I mean:
=RTD("fxbluelabs.excelrtd", ,"account number", "@bh,GBPUSD,H4,close,1") will get you the last close bar. Change the number at the end to 0 and you get current bar. Or change it to 200 and you get bar number 200.
=RTD("fxbluelabs.excelrtd", ,"account number","@rsi,GBPUSD,H4,14,2") will get you RSI value for H4 two bars ago.
Do not panic from these formulas. These are copy-pasted from a long PDF each broker (that has this Excel RTD EA through fxbluelabs) will provide it for you. The PDFs vary from one broker to another with how descriptive they are.
------------
Some PDFs:
From peperstone:
Attached File(s)
From JFD :
Attached File(s)
From ThinkMArkets:
Attached File(s)
