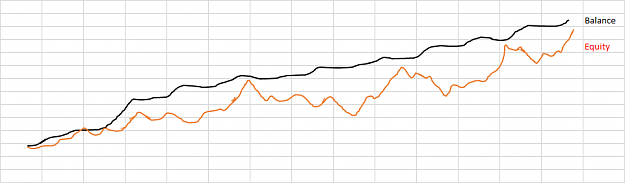
Thanks. Seeing your balance curve, I'm getting excited in digging deeper into understanding this kind of strategy.
Is it possible to use Google Sheets to do this or do you really need MS Excel?
Is it possible to use Google Sheets to do this or do you really need MS Excel?