• Home
  • Forums
  • Trades
  • News
  • Calendar
  • Market
  • Brokers
  • Login
  • Join
  • User/Email: Password:
  • 8:26am
Menu
  • Forums
  • Trades
  • News
  • Calendar
  • Market
  • Brokers
  • Login
  • Join
  • 8:26am
Sister Sites
  • Metals Mine
  • Energy EXCH
  • Crypto Craft

Options

Bookmark Thread

First Page First Unread Last Page Last Post

Print Thread

Similar Threads

Looking For the "Market Club Triangles" indicator? 2 replies

any one trading forex with just Triangles? 0 replies

unfilled rectangles and triangles in MT4? 2 replies

Help me find this indi - trends, wedges, and triangles 0 replies

Indicator to pick out triangles 0 replies

  • Trading Systems
  • /
  • Reply to Thread
  • Subscribe
  • 44
Attachments: Trading multipair triangles, no stoploss
Exit Attachments
Tags: Trading multipair triangles, no stoploss
Cancel

Trading multipair triangles, no stoploss

  • Last Post
  •  
  • 1 Page 23 4
  • 1 Page 23 4
  •  
  • Triangle methodology | Brokerage Account XXXXXXXXXXXXXXXX08 Starting May 31, 2019
  • Last Sync: Never
  • All History
  • Today
  • Yesterday
  • This Week
  • This Month
  • This Year
  • Last Week
  • Last Month
  • Last Year
to
No trading activity in this period.
  • triangles no hedge | Brokerage Account XXXXXXXXXXXXXXXX07 Starting Dec 7, 2019
  • Expand
  • Retract
  • Last Sync: 37 hr ago
  • Overview

  • Trade Report

  • Trade Graph

  • Trade List

37 hr ago
Last Sync: 37 hr ago
  • Overview

  • Trade Report

  • Trade Graph

  • Trade List

  • Period: All History

37 hr ago
Last Sync: 37 hr ago
  • Overview

  • Trade Report

  • Trade Graph

  • Trade List

37 hr ago
Last Sync: 37 hr ago
  • Overview

  • Trade Report

  • Trade Graph

  • Trade List

37 hr ago
Last Sync: 37 hr ago
  • All History
  • Today
  • Yesterday
  • This Week
  • This Month
  • This Year
  • Last Week
  • Last Month
  • Last Year
to
No trading activity in this period.
  • Post #21
  • Quote
  • May 24, 2019 7:28pm May 24, 2019 7:28pm
  •  LDFX
  • Joined Jul 2012 | Status: Member | 970 Posts
Quoting marecki
Disliked
Before continuing let me welcome You in this thread! sam 68: thank You for Your interest, I hope You'll enjoy it! kaixinjili: Yes I did, I am now testing it in more advance scope. I think there will be time to start simple and make it more advanced after. zotium: Actually You're not that wrong. In this strategy we will be trading few pairs at the same time, sometimes hedging like in Your example. LDFX: This thread is not to argue or to prove something to anybody. Let's keep this thread as a place for constructive discussion. Like I said on the beginning,...
Ignored

Well,

I do respect that you share some original ideas about trading but without stop loss is just a recipe for disaster.

First thing in trading is to manage the losses, which you don’t.

If you know where to enter and where to take profit, why don’t you know where to exit with a loss ?
LDFX Trading Ltd
 
 
  • Post #22
  • Quote
  • May 24, 2019 7:55pm May 24, 2019 7:55pm
  •  WhipKream
  • | Joined Nov 2018 | Status: Member | 416 Posts
I think he does it because he has the confidence to do so. I am currently trading without stoplosses and while it hasn't worked due to my poor risk management system in the past, cautious approaches between pairs can be used in my opinion. His trading system plays off of the gaps between the pairs he trades I think, and the swap rates that large institutions use when trading their orders. But I am just guessing, I just don't believe that a system has to take losses if traded correctly, provided high market liquidity.
 
1
  • Post #23
  • Quote
  • May 24, 2019 8:26pm May 24, 2019 8:26pm
  •  mankindeg
  • | Joined Mar 2015 | Status: Member | 143 Posts
Quoting LDFX
Disliked
{quote} Well, I do respect that you share some original ideas about trading but without stop loss is just a recipe for disaster. First thing in trading is to manage the losses, which you don’t. If you know where to enter and where to take profit, why don’t you know where to exit with a loss ?
Ignored

Correct. Now, the OP says that he closes all trades by the end of the week. But what if News of any kind happen? What if the equity is suddenly 50% down? I mean sure, then you can still "close all trades" by the end of the week, but it is a recipe for disaster. I like the general idea. It's something original, but it really needs some kind of stoploss, in case of news or ANY big moves that can happen.
 
1
  • Post #24
  • Quote
  • May 24, 2019 9:24pm May 24, 2019 9:24pm
  •  LDFX
  • Joined Jul 2012 | Status: Member | 970 Posts
Quoting WhipKream
Disliked
I think he does it because he has the confidence to do so. I am currently trading without stoplosses and while it hasn't worked due to my poor risk management system in the past, cautious approaches between pairs can be used in my opinion. His trading system plays off of the gaps between the pairs he trades I think, and the swap rates that large institutions use when trading their orders. But I am just guessing, I just don't believe that a system has to take losses if traded correctly, provided high market liquidity.
Ignored
« I just don’t believe a system has to take losses if traded correctly « , so why not using stop loss instead of letting them run ?

If he had any confidence other than in delusion, he would use stop loss.
LDFX Trading Ltd
 
1
  • Post #25
  • Quote
  • May 24, 2019 11:04pm May 24, 2019 11:04pm
  •  WhipKream
  • | Joined Nov 2018 | Status: Member | 416 Posts
Why cut and start again if that is the problem that I have? I end up cutting at losses instead of just waiting for the market to move in the direction it was showing instead of giving into fear. If properly managed, the risk should be tolerable in my systems even if big news (300-500 pips) occurred that moved in the wrong direction. But isn't news just a driving factor of said movements? I just decided I would look for good deals from now on, that's all. I watch the markets everyday, it is not that I have no vice. Why worry about a losing trade if I am still making my swap on it? Or better yet, why not scale into my positions properly, looking for better and better deals? I think you just misunderstand my point. I do not tell you how to trade, stoplosses are for those who do not have confidence in the markets, or understand them in my opinion. But to each his own. Surviving is not the same as thriving. I am no salamander
 
1
  • Post #26
  • Quote
  • May 24, 2019 11:08pm May 24, 2019 11:08pm
  •  Effax-square
  • | Joined Oct 2013 | Status: Member | 34 Posts
subscribed....

hope there are more example/elaborate details of the logic behind this system

i read through it once, cant quite get it yet...will be waiting for more post to explain the system
 
1
  • Post #27
  • Quote
  • May 24, 2019 11:29pm May 24, 2019 11:29pm
  •  WhipKream
  • | Joined Nov 2018 | Status: Member | 416 Posts
My apologies, I am in the same boat as you, the wording in one of your sentences confused me is all. GL to you!
 
1
  • Post #28
  • Quote
  • May 25, 2019 1:37am May 25, 2019 1:37am
  •  marecki
  • | Joined Jul 2013 | Status: Member | 122 Posts
Gentlemen, many of traders in this thread are hungry of examples to see how this works, so before elaborating more theory let's put some orders to the market.

First what I do is prepare my quick prediction of what will happen the few next days. Time horizon for our session is one or two weeks, so I'll look on h4.
In order to do so I use bollinger band (75,3), which gives me also some information about expected scope of the move.

Attached Image (click to enlarge)
Click to Enlarge

Name: predictions.png
Size: 29 KB


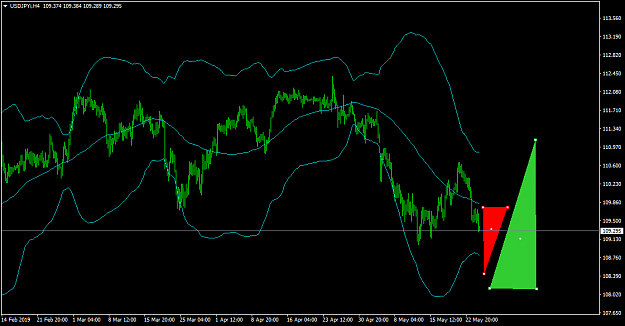
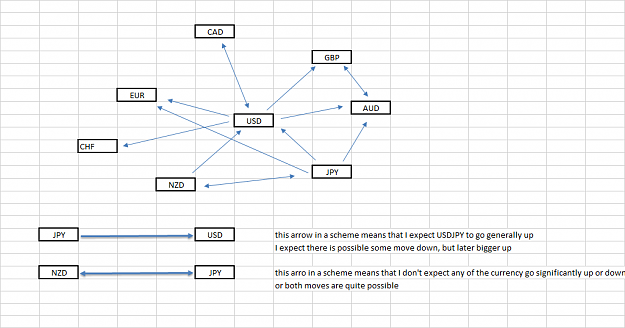
Now let's take for example USDJPY pair which. like in a scheme, I'll be trading mostly LONG.
Here is a chart with shown triangles of how I will be preparing orders.
Of course I don't draw triangles for myself each time. I do it now for better understanding for thread readers.

Attached Image (click to enlarge)
Click to Enlarge

Name: USDJPYiH4.png
Size: 34 KB


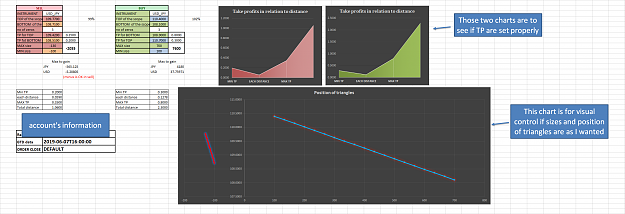
So now I go to the FORM spreadsheet and I'm preparing sets of orders:

Attached Image (click to enlarge)
Click to Enlarge

Name: FORM25MAYUJ.png
Size: 136 KB


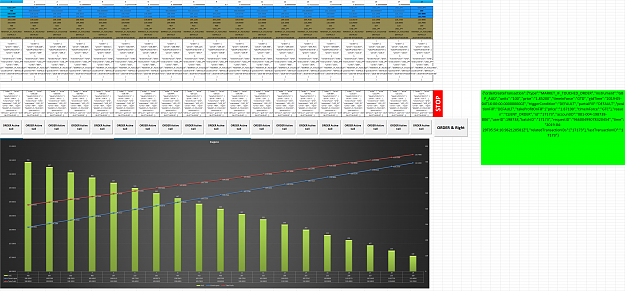
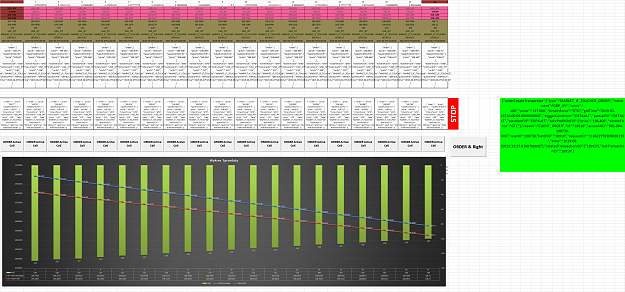
Then opening orders on two next spreadsheets:

Attached Image (click to enlarge)
Click to Enlarge

Name: BUY25MAYUJ.png
Size: 724 KB


Attached Image (click to enlarge)
Click to Enlarge

Name: SELL25MAYUJ.png
Size: 637 KB


After putting those orders to the market I start preparing similarily other pairs. I'll post further charts in next posts.
Also I'll show how I read the bollinger band in order to make better decisions.
 
 
  • Post #29
  • Quote
  • May 25, 2019 8:26am May 25, 2019 8:26am
  •  marecki
  • | Joined Jul 2013 | Status: Member | 122 Posts
General rule which I use in my trading is to watch Bollinger Band.
I am personally used to look at 75 period and 3 standard deviation BB, which You can see on charts I post.

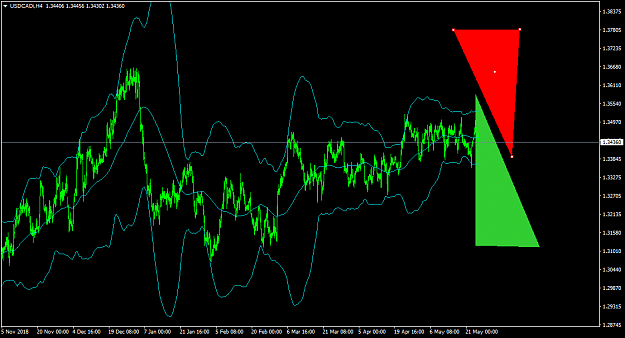
Below is USDCAD chart :
Attached Image (click to enlarge)
Click to Enlarge

Name: USDCADiH4.png
Size: 44 KB


In relation to the past few months current bands are pretty thin.
I do not trust such levels of bands, as bigger moves tend to start when standard deviation is small.
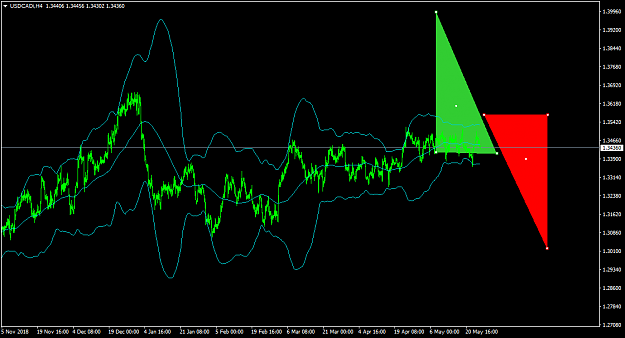
In this case I trade one of two methods:
1. I put triangles like in a chart above (when expecting middle size moves)
2. I put triangles like below (when expecting bigger moves):

Attached Image (click to enlarge)
Click to Enlarge

Name: USDCADiH4_2.png
Size: 39 KB


however I have experienced, that relative TakeProfits should be longer in case #2.
 
1
  • Post #30
  • Quote
  • May 25, 2019 3:17pm May 25, 2019 3:17pm
  •  zotium
  • | Joined Feb 2019 | Status: Member | 29 Posts
This thread is getting better by the day. I like how you use a "flow" diagram of the currencies. It just gave me an idea on how to use this for my own trading.

I hope you don't get discouraged by the negativity of others in this thread. Please keep it up and ignore them. They clearly are in a very different level.
 
 
  • Post #31
  • Quote
  • May 25, 2019 4:53pm May 25, 2019 4:53pm
  •  marecki
  • | Joined Jul 2013 | Status: Member | 122 Posts
Quoting zotium
Disliked
This thread is getting better by the day. I like how you use a "flow" diagram of the currencies. It just gave me an idea on how to use this for my own trading. I hope you don't get discouraged by the negativity of others in this thread. Please keep it up and ignore them. They clearly are in a very different level.
Ignored
Thank You zotium, it's very nice to hear. That is why I want to share my ideas.

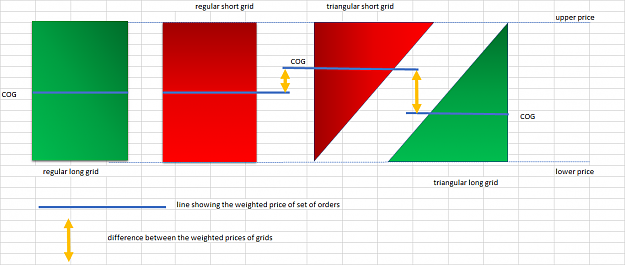
Let's continue then and get back to the general idea of triangle grid. I'll be sometimes using a word COG (Center Of Gravity).
This is what make a big difference between regular grid and triangle one. Let's take a look on a drawing:

Attached Image (click to enlarge)
Click to Enlarge

Name: COG.png
Size: 39 KB


COG means a weigthed average price of a grid.
It's a comparison of different characteristic grids by their COG position.
This is one of important factors that decide about exposure to risk.
When traded traingles both directions very important is relative position of particular COGs.

The most comfortable situation is when COG of short orders is much higher than COG of long orders.
Sometimes however, we want to trade like in #Post 29 the second chart. Then COGs might have negative difference, and in that case profit is made only by catching TakeProfits.
 
2
  • Post #32
  • Quote
  • May 25, 2019 6:00pm May 25, 2019 6:00pm
  •  SunnyCoast
  • Joined Feb 2019 | Status: Member | 1,285 Posts
Hi Marecki.

Thank you for making the decision to share your wonderful knowledge and skill.

I'm still very new to currency trading but am slowly and surely finding my feet.

I'll follow along patiently for you to explain all you wish to share here and learn as much as I can.

Cheers
Anthony
Empty your mind and let the market guide you
 
 
  • Post #33
  • Quote
  • May 26, 2019 12:08am May 26, 2019 12:08am
  •  Effax-square
  • | Joined Oct 2013 | Status: Member | 34 Posts
ok briefly, let me in my own words, explain my understanding of this system...correct me if i am wrong

assume we are trading EUR/USD, and current price is at 1.2000

so we enter a pending long trade at 1.1180, say lot is 0.01, take profit 20 pips (this being the closest to the current market price of 1.2000)

and we place pending long at 1.1160, say lot is 0.02, take profit 25 pips (further away from 1.2000, increase size and take profit)

and we place pending long at 1.1140, 0.03 lot, take profit 30 pips
pending long 1.1120, 0.04 lot, take profit 35 pips
pending long 1.1100, 0.05 lot, take profit 40 pips and so on...

did i get it correctly? (ignoring the lot size calculation ratio i.e. in simplified manner)

and sometimes pending long could be in the other way (go long in trend direction)
pending long 1.2020, 0.01 lot, tp 20 pips
pending long 1.2040, 0.02 lot, tp 25 pips
pending long 1.2060, 0.03 lot, tp 30 pips and so on
 
 
  • Post #34
  • Quote
  • Edited 1:02pm May 26, 2019 7:11am | Edited 1:02pm
  •  marecki
  • | Joined Jul 2013 | Status: Member | 122 Posts
Hi Effax-square

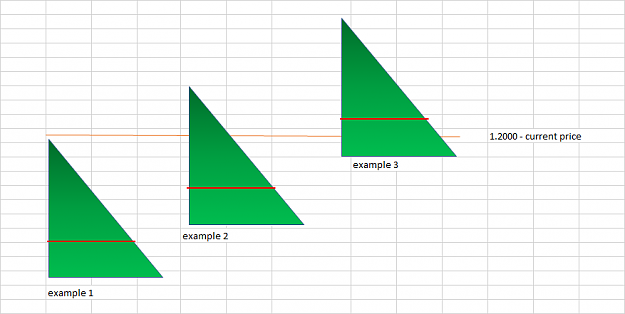
I'll try to visualize Your example.

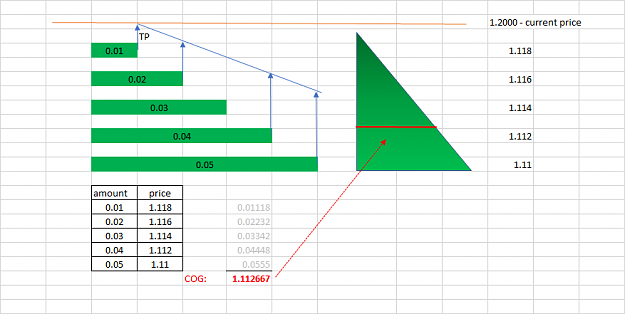
1.2000 is current price, and Your 1st triangle looks like this:

Attached Image (click to enlarge)
Click to Enlarge

Name: effaxsquare1.png
Size: 21 KB


This is a good example of long orders triangle - COG is 1.1126 (of course when all pending orders open).

Let's visualize Your second example.

Attached Image (click to enlarge)
Click to Enlarge

Name: effaxsquare2.png
Size: 10 KB


This triangle is actually reversed, because instead of improving COG it is making it worse.
We can use normal triangle over the current price, but desired is a type of triangle like in Your first example.
Better is to start like in one of examples below:

Attached Image (click to enlarge)
Click to Enlarge

Name: effaxsquare3.png
Size: 18 KB


Not without a reason I'm not telling that example 2 triangle is wrong.
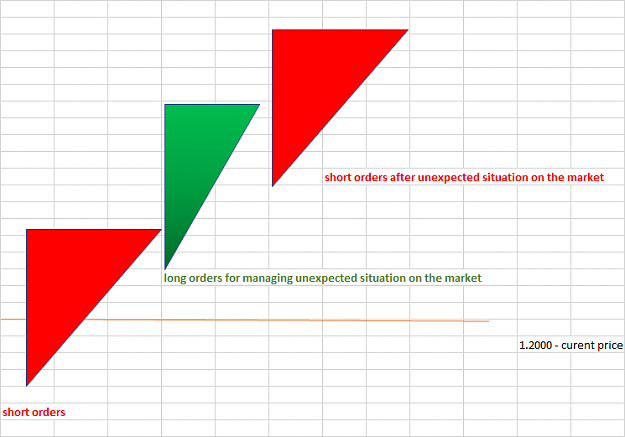
Reversed triangle can be very usefull, when managing a risk of market situation that is much different than preliminary predicted.

Let's assume that You are trading EURUSD mostly short.
Reversed triangle like in example 2 might be used like this:

Attached Image (click to enlarge)
Click to Enlarge

Name: effaxsquare4.png
Size: 20 KB


(on the drawing only green triangle is reversed)
 
 
  • Post #35
  • Quote
  • May 26, 2019 6:09pm May 26, 2019 6:09pm
  •  marecki
  • | Joined Jul 2013 | Status: Member | 122 Posts
Quoting LDFX
Disliked
{quote} Yes, a Trend Explorer would be interesting to see, but I guess you will never see one.
Ignored
Hi LDFX.
I started trading with this method around September/October 2018.
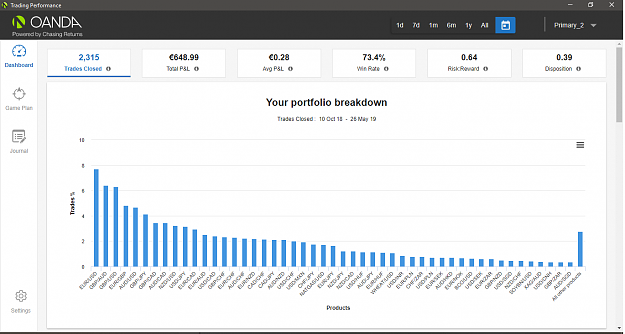
Below is image of dashboard of Trading Performance.

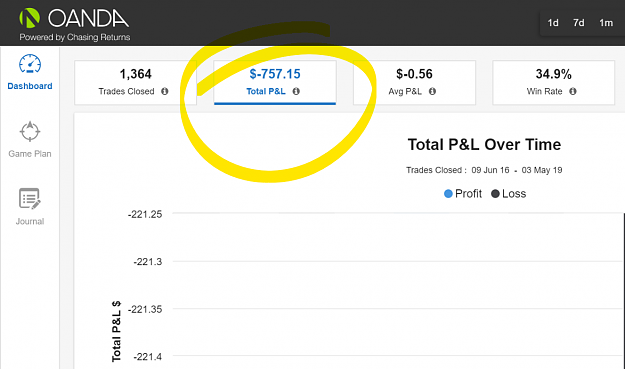
Attached Image (click to enlarge)
Click to Enlarge

Name: LDFX1.png
Size: 73 KB


Like I wrote before I trade small, but always real money.

Please note that I started to trade on weekly charts, so around 100% profit in 8 months may not seem like fireworks.
During those few months I came from manual preparing of orders to Excel based application that can open/close thousand orders in less than a half an hour.
Now I share this idea on FF and at the same time I am testing this strategy on lower TimeFrames.
ForexFactory users will have very fresh information of this system performance.

I think that for You also interesting will be parameter on left: disposition 0.39

description by OANDA:
Disposition number tells how long you spend in winners versus losers. A disposition below 1.00 indicates that you are spending more time in losing trades than winning trades.

Like I wrote before I'll organize account with some deposit to start Trade Explorer.

Best Regards, and hope You'll enjoy the thread.
 
2
  • Post #36
  • Quote
  • May 27, 2019 6:10am May 27, 2019 6:10am
  •  zotium
  • | Joined Feb 2019 | Status: Member | 29 Posts
Hi Marecki,

Could you also share your equity curve for this strategy?

I don't know much about options, but this strategy seems like one of those options strategies straddle and strangle and butterflies etc.
 
 
  • Post #37
  • Quote
  • May 27, 2019 7:41am May 27, 2019 7:41am
  •  marecki
  • | Joined Jul 2013 | Status: Member | 122 Posts
Quoting zotium
Disliked
Hi Marecki, Could you also share your equity curve for this strategy? I don't know much about options, but this strategy seems like one of those options strategies straddle and strangle and butterflies etc.
Ignored
Hi zotium

If I only know how, I will. However I don't register the equity in any way.
I can easily make balance curve from transactions history from broker's site, but it will not tell You much about the equity curve.
Few months ago OANDA was still making brilliant accounts' statements. In that statements there was always a small chart of balance vs equity.
However from some time those statements are simpler and do not have such charts anymore.
I must admit, that sometimes I also would like to analyze the equity instead of balance, but yet have no simple idea how to do it.

Another thing - this thread is only about trading FX, not about options. Same as You I don't know much about options.
(I needed to google what actually means "straddle and strangle")
Triangles that You see on my drawings are only graphical interpretation of orders sets.

Regards!
 
 
  • Post #38
  • Quote
  • May 27, 2019 8:16am May 27, 2019 8:16am
  •  marecki
  • | Joined Jul 2013 | Status: Member | 122 Posts
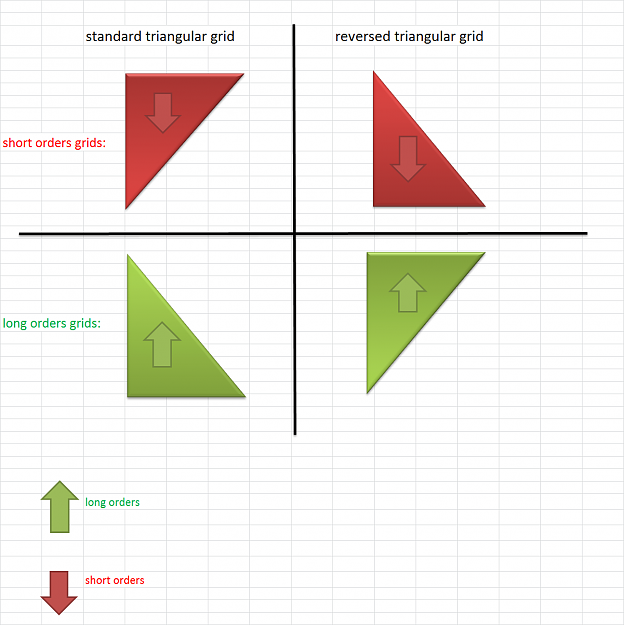
If last image in # Post 34 made some confusion there is another image to show which triangular grid is standard and which is reversed:

Attached Image (click to enlarge)
Click to Enlarge

Name: grids_standard_reversed.png
Size: 92 KB


Reversed grids are worsening the COG and total profitability so I use it only for loss management or for gaining some additional margin if I am out of.

In next post I'll put some example so not to make this thread about some silly drawings which most readers may not understand.

Regards!
 
 
  • Post #39
  • Quote
  • May 27, 2019 4:07pm May 27, 2019 4:07pm
  •  zotium
  • | Joined Feb 2019 | Status: Member | 29 Posts
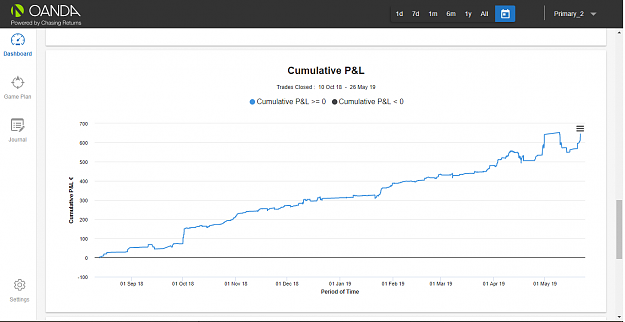
In the Oanda Trading Performance, click on the "Total P&L" box. Then it will show you a lot of different reports. Scroll down and you should see the "Cumulative P&L" which should be representative of the equity curve. It took me a while to figure this out too. The user interface is counterintuitive.

Attached Image (click to enlarge)
Click to Enlarge

Name: Screenshot2.png
Size: 94 KB
 
 
  • Post #40
  • Quote
  • Edited May 28, 2019 12:01am May 27, 2019 11:33pm | Edited May 28, 2019 12:01am
  •  marecki
  • | Joined Jul 2013 | Status: Member | 122 Posts
Hi Zotium,

Here is graph You are asking for. I didn't think much about it, but this is what I was calling my balance curve.

Attached Image (click to enlarge)
Click to Enlarge

Name: zotium.png
Size: 36 KB
 
2
  • Trading Systems
  • /
  • Trading multipair triangles, no stoploss
  • Reply to Thread
    • 1 Page 23 4
    • 1 Page 23 4
0 traders viewing now
  • More
Top of Page
  • Facebook
  • Twitter
About FF
  • Mission
  • Products
  • User Guide
  • Media Kit
  • Blog
  • Contact
FF Products
  • Forums
  • Trades
  • Calendar
  • News
  • Market
  • Brokers
  • Trade Explorer
FF Website
  • Homepage
  • Search
  • Members
  • Report a Bug
Follow FF
  • Facebook
  • Twitter

FF Sister Sites:

  • Metals Mine
  • Energy EXCH
  • Crypto Craft

Forex Factory® is a brand of Fair Economy, Inc.

Terms of Service / ©2023